At times, the stock market can seem like a mystery—a hard-to-solve puzzle. But like any good detective, we have tools to help peel away the layers and unearth some underlying truths about the stock market.
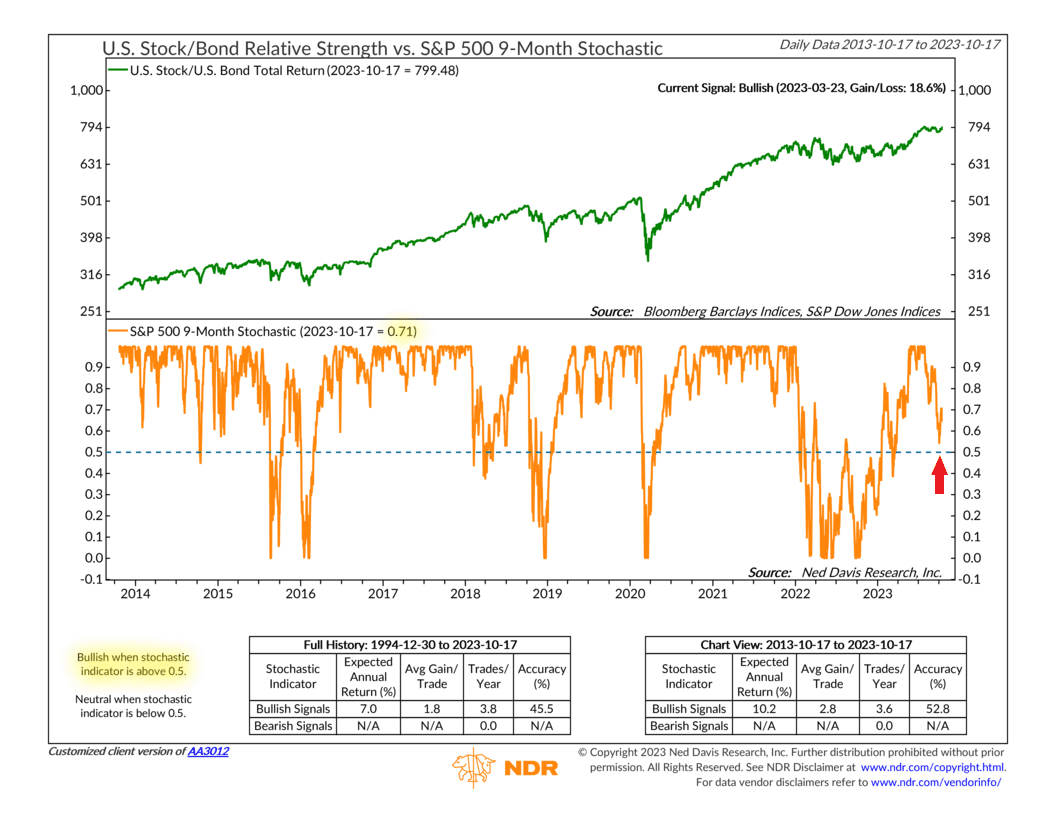
One such tool is an indicator called a stochastic. A stochastic is a popular technical indicator used to measure stock market momentum over a specified range or period of time. In this specific case, we are using a stochastic that compares the closing price of the S&P 500 Index to its 9-month price range (orange line, bottom clip). It’s range-bound, so a reading of 0% means the index has closed at the bottom of its 9-month range, and a reading of 100% means it closed at the top of its 9-month range.
Usually, traders use a stochastic indicator to determine when the market is overbought or oversold. However, we find that using the stochastic over a time frame of nine months is best served in measuring the stock market’s underlying trend.
For example, when the stochastic is above 50% (0.5 on the chart), it means the market is trading in the upper 50% of its 9-month price range. Typically, this is a sign that the market is in an uptrend, where returns for the index have historically been the strongest. Below 50%, however, it likely means the market is going through a rough patch, and it would typically be best to wait things out until the price action improves.
Just eyeballing the chart, you can see how significant dips in the U.S. stock/bond ratio (green line, top clip) have tended to occur when the 9-month stochastic has dipped below 50%. In contrast, strong market uptrends tend to happen when the stochastic is greater than 50%.
Looking at recent history, we see that the stochastic fell severely below 50% near the beginning of 2022, and the stock/bond ratio was essentially flat for a whole year. However, the stochastic rose above 50% earlier this year, and the market has performed quite a bit better.
Starting in August, the stochastic indicator began rapidly declining from its highs, and the stock market sold off in response. However, the potentially good news is that the stochastic has avoided dipping below the dreaded 50% line. It has actually bounced quite nicely recently and is currently about 70%.
We take this as a sign that, for the time being, the stock market is down but not entirely out—at least as far as the stock market’s price momentum is concerned. The price action could certainly deteriorate more from here, but if this indicator can stay above 50%, it would be a sign that the market has avoided worsening into a more significant, longer-term downtrend.
This is intended for informational purposes only and should not be used as the primary basis for an investment decision. Consult an advisor for your personal situation.
Indices mentioned are unmanaged, do not incur fees, and cannot be invested into directly.
Past performance does not guarantee future results.
The S&P 500 Index, or Standard & Poor’s 500 Index, is a market-capitalization-weighted index of 500 leading publicly traded companies in the U.S.
