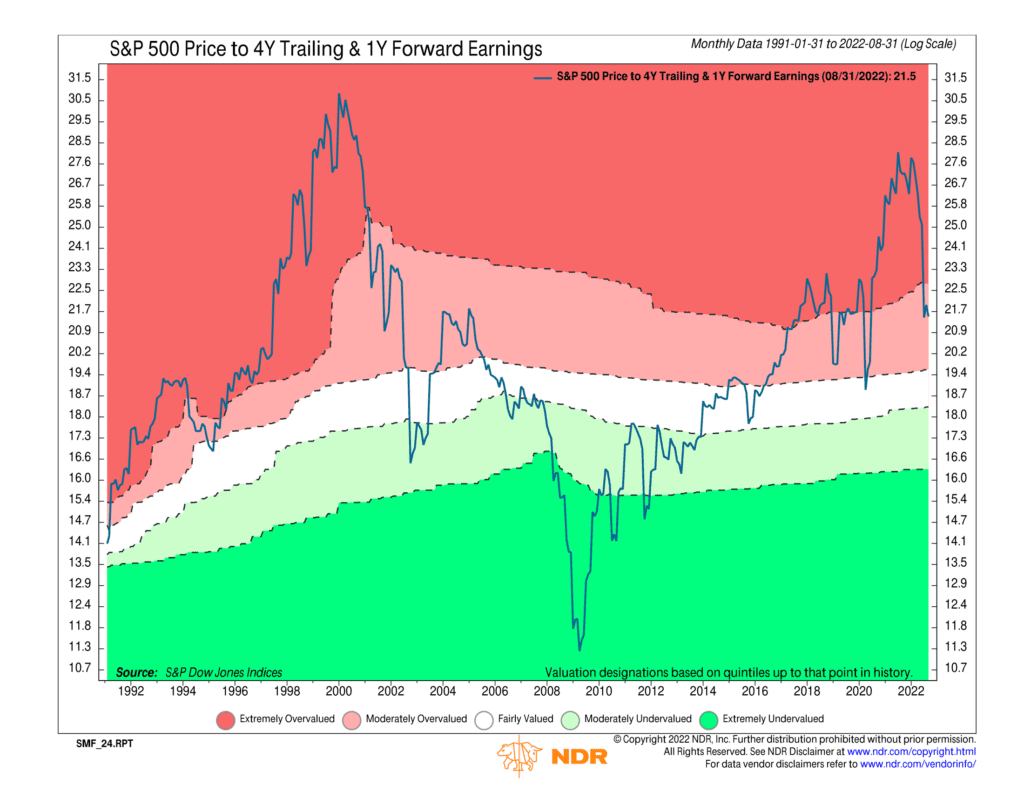
There are many ways to measure the valuation of something like the stock market. Some people like to look at past earnings; others look at future expected earnings. There is no “right” answer here. As they say, valuation is in the eye of the beholder. But we’ve found that combining past and future earnings is an excellent way to develop a good sense of overall stock market valuation.
The indicator above does this by joining together two price-to-earnings ratios. The first is the price of the S&P 500 Index divided by the past 4-year trailing earnings, and the second is the price of the S&P 500 Index divided by 1-year forward (or expected future) earnings. This combination generates the blue line on the chart, which rises when stock prices rise relative to past and future earnings and falls when stock prices decline relative to past and future earnings.
But how do we know when the stock market is over/undervalued relative to past and future earnings? That’s where the shaded areas come in. The indicator breaks the data into quintiles (5 equal parts), with the dark red shaded area representing the most overvalued quintile up to that point in history and the dark green shaded area representing the most undervalued.
The driving concept behind this indicator is that future expected returns for the S&P 500 go down the higher this valuation measure gets. In contrast, future expected returns go up the lower this valuation measure gets.
And historically, the data back this assumption up. The data are monthly and only go back to 1991, but the highest the S&P 500 Index’s price ever reached was over 30 times past and future earnings in 2000, right at the top of the dot-com bust. Over the next decade, stock prices went essentially nowhere until valuations reached significantly undervalued levels in 2009, and a new bull market began.
Looking at more recent history, we can see that the most recent bull market peaked around 28 times past and future earnings, the second most overvalued in history. The measure has since dropped to about 21.5 times past and future earnings.
The bad news? Despite the drop in stock prices this year, this is still moderately overvalued territory (light-red shading), based on the indicator. So, according to history, the S&P 500 is not necessarily a screaming “buy” at this point.
This is intended for informational purposes only and should not be used as the primary basis for an investment decision. Consult an advisor for your personal situation.
Indices mentioned are unmanaged, do not incur fees, and cannot be invested into directly.
Past performance does not guarantee future results.
