When the stock market is down, we have a few tools in our toolkit that we use to gauge when the selling might be over. This week’s indicator, measuring 9-to-1 Up Days, is one of them. It produces a somewhat rare but historically important signal that tends to suggest strong upside momentum when it occurs.
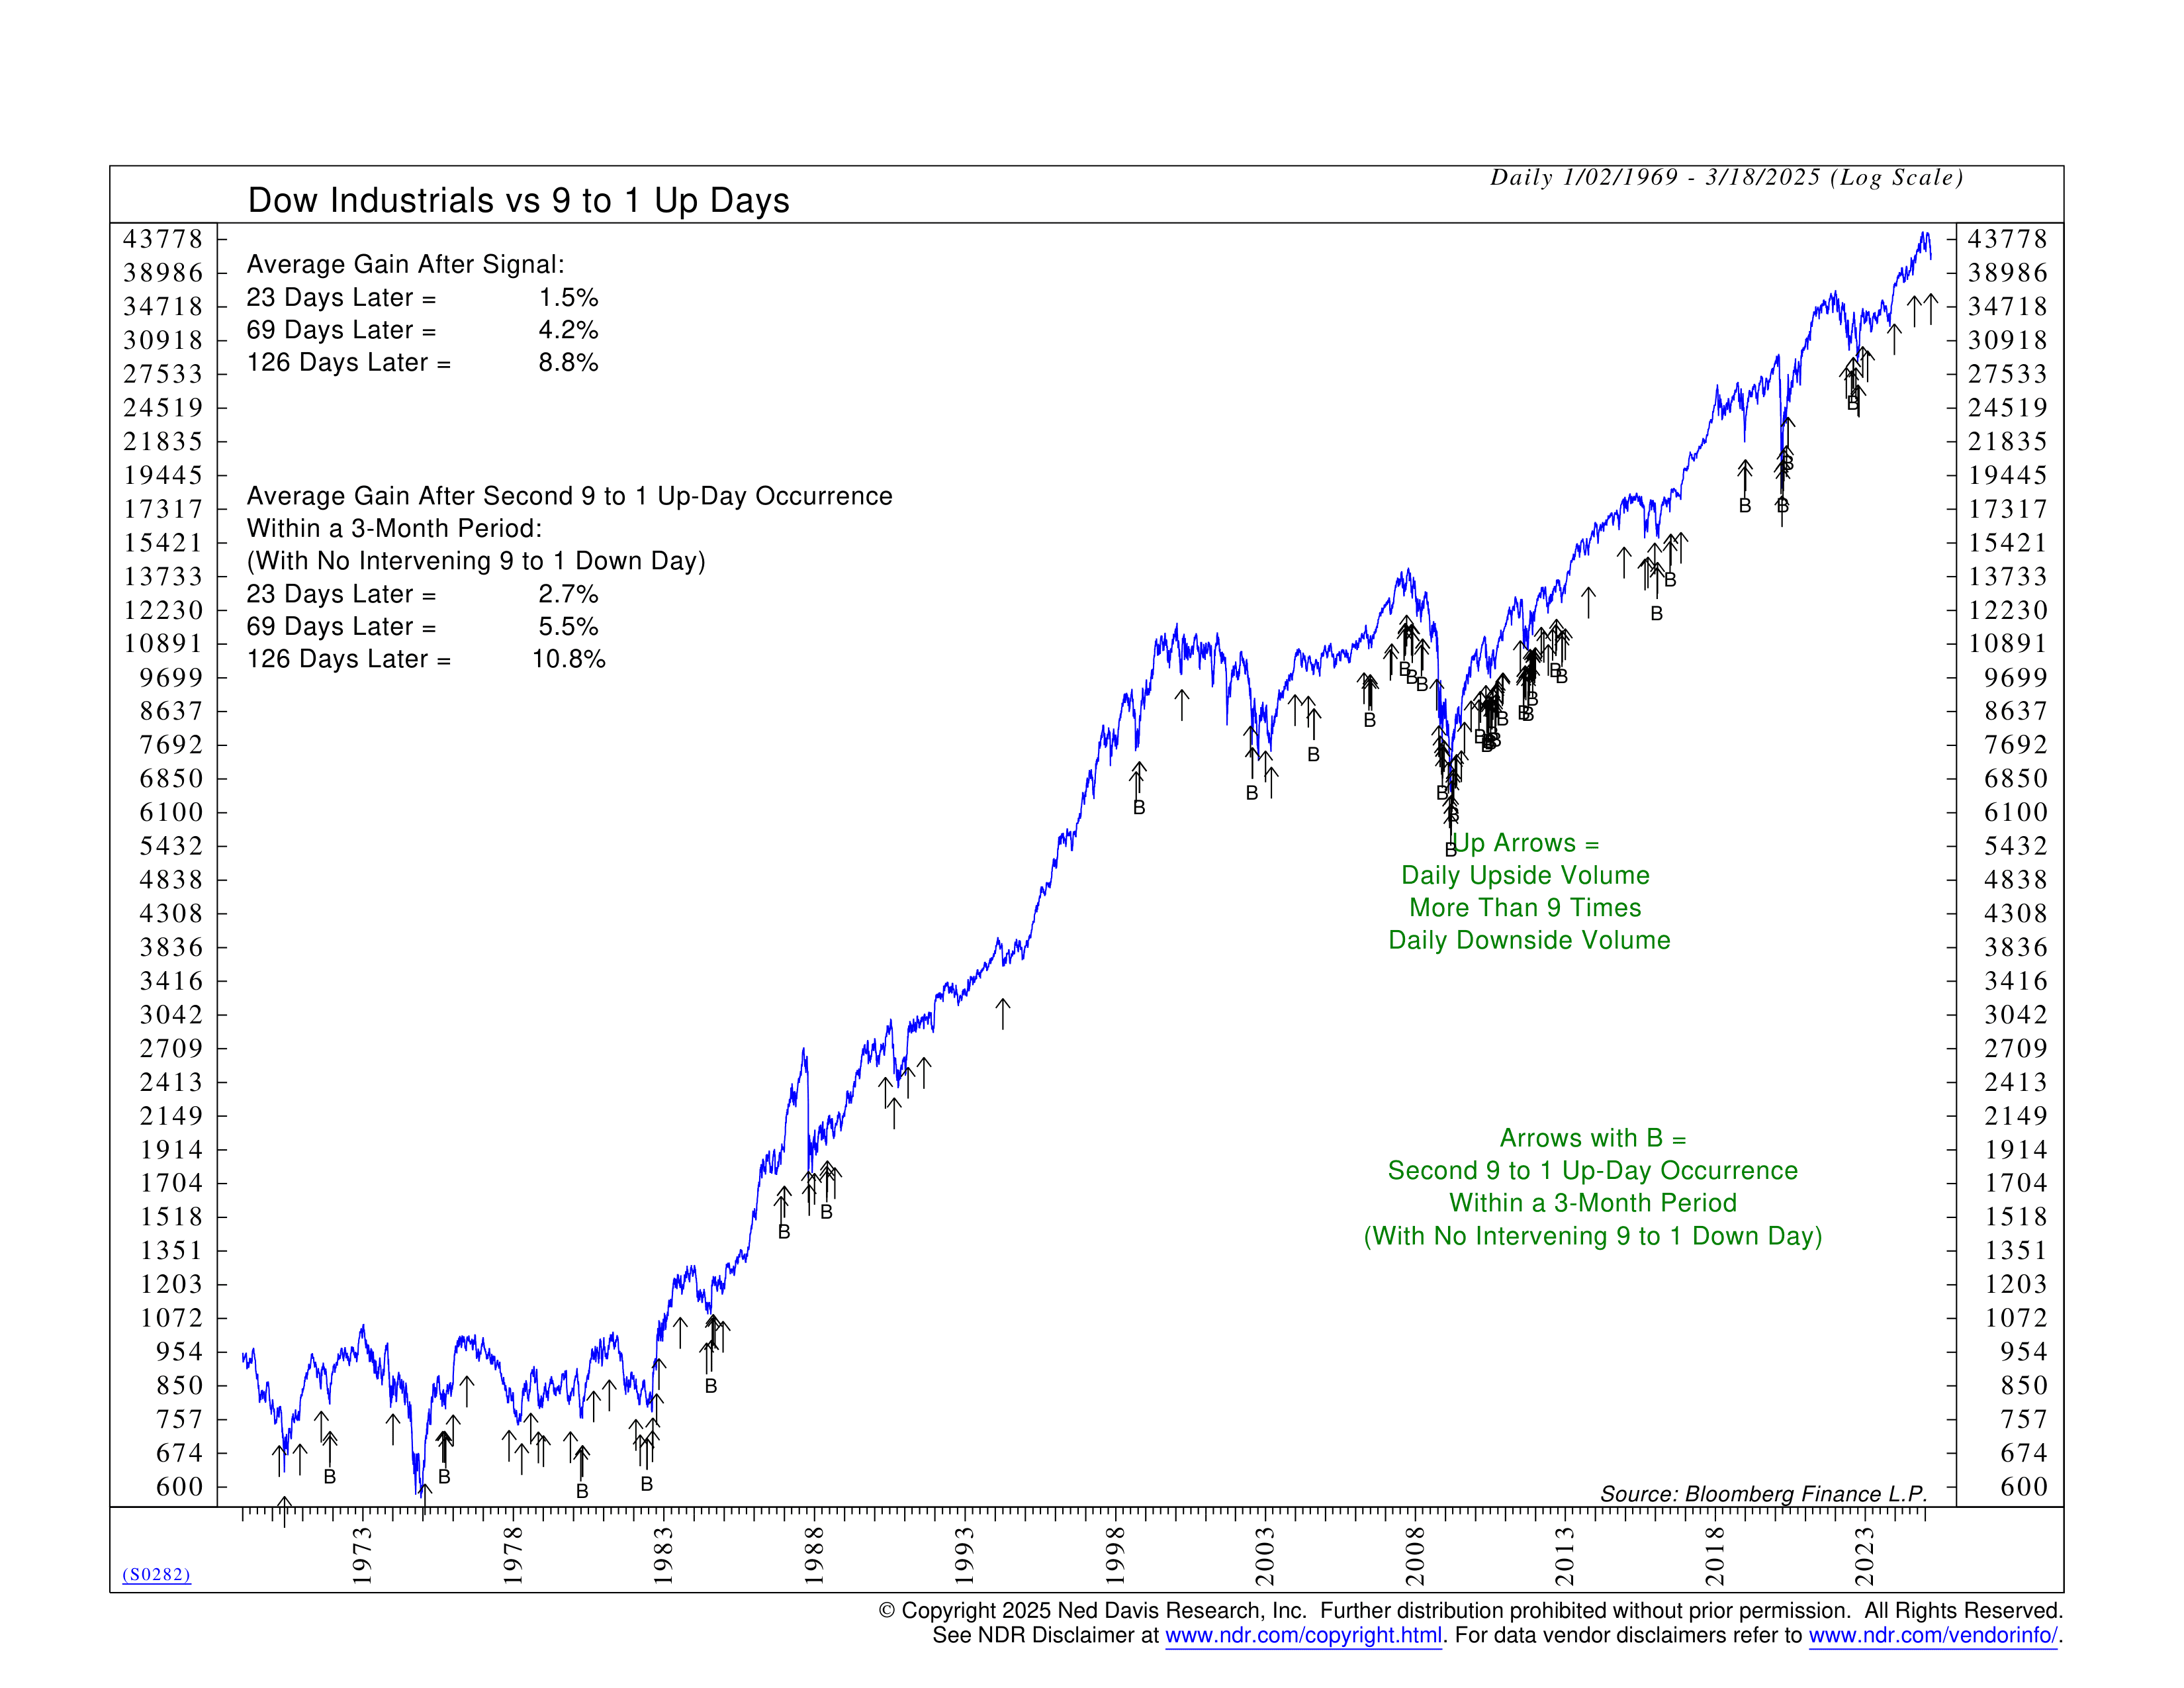
Here’s how it works. The chart shows the performance of the Dow Jones Industrial Average—aka the stock market—over the past 55+ years. The indicator tracks days when the total volume of rising stocks in the index outpaces the volume of declining stocks by at least a 9-to-1 ratio. Think of it like a tidal wave of buyers overwhelming sellers—a sign that bullish sentiment is taking hold.
Why does it matter? Historically, when we see one of these big thrust days, the market tends to perform well in the months ahead. Twenty-three days later, the market was up 1.5% on average. Sixty-nine days later, gains grew to 4.2%. And 126 days later, returns climbed to 8.8%.
That’s solid, but here’s where things get really interesting. When a second 9-to-1 Up Day occurs within three months without an intervening 9-to-1 Down Day, returns are even stronger. Twenty-three days later, the market gained 2.7%. Sixty-nine days later, it was up 5.5%. And 126 days later, returns increased to 10.8%. In other words, one thrust is good, but two close together confirm that buyers are in control.
Where are we now? On March 14th, we registered a 9-to-1 Up Day, signaling a surge in buying power. That’s a great sign, but history tells us that a second confirming thrust in the next three months would make the case for an even stronger rally. If we see another one of these big momentum days soon, the probabilities of higher returns improve even further.
Bottom line? The first push was promising, but for a truly bullish signal, we’d like to see another 9-to-1 Up Day before mid-June. If that happens, history suggests we could be in for a much more powerful rally. Stay tuned—this is one momentum signal worth watching!
This is intended for informational purposes only and should not be used as the primary basis for an investment decision. Consult an advisor for your personal situation.
Indices mentioned are unmanaged, do not incur fees, and cannot be invested into directly.
Past performance does not guarantee future results.
The Dow Jones Industrial Average (DJIA) is a price-weighted index composed of 30 widely traded blue-chip U.S. common stocks.