When a bunch of stocks skyrocket at the same time, in a strong and sudden fashion, we call it a breadth thrust. It’s a good thing for the overall stock market, as it’s a sign of a healthy and robust environment.
Typically, when the market is in the beginning stages of a new major upturn, we often see a lot of these breadth thrust indicators come to life. The more there are, the better the rally.
Therefore, this week’s indicator takes 12 commonly watched breadth thrust indicators and consolidates them into just one indicator. This helps us measure the “breadth” of the breadth thrusts, if you will.
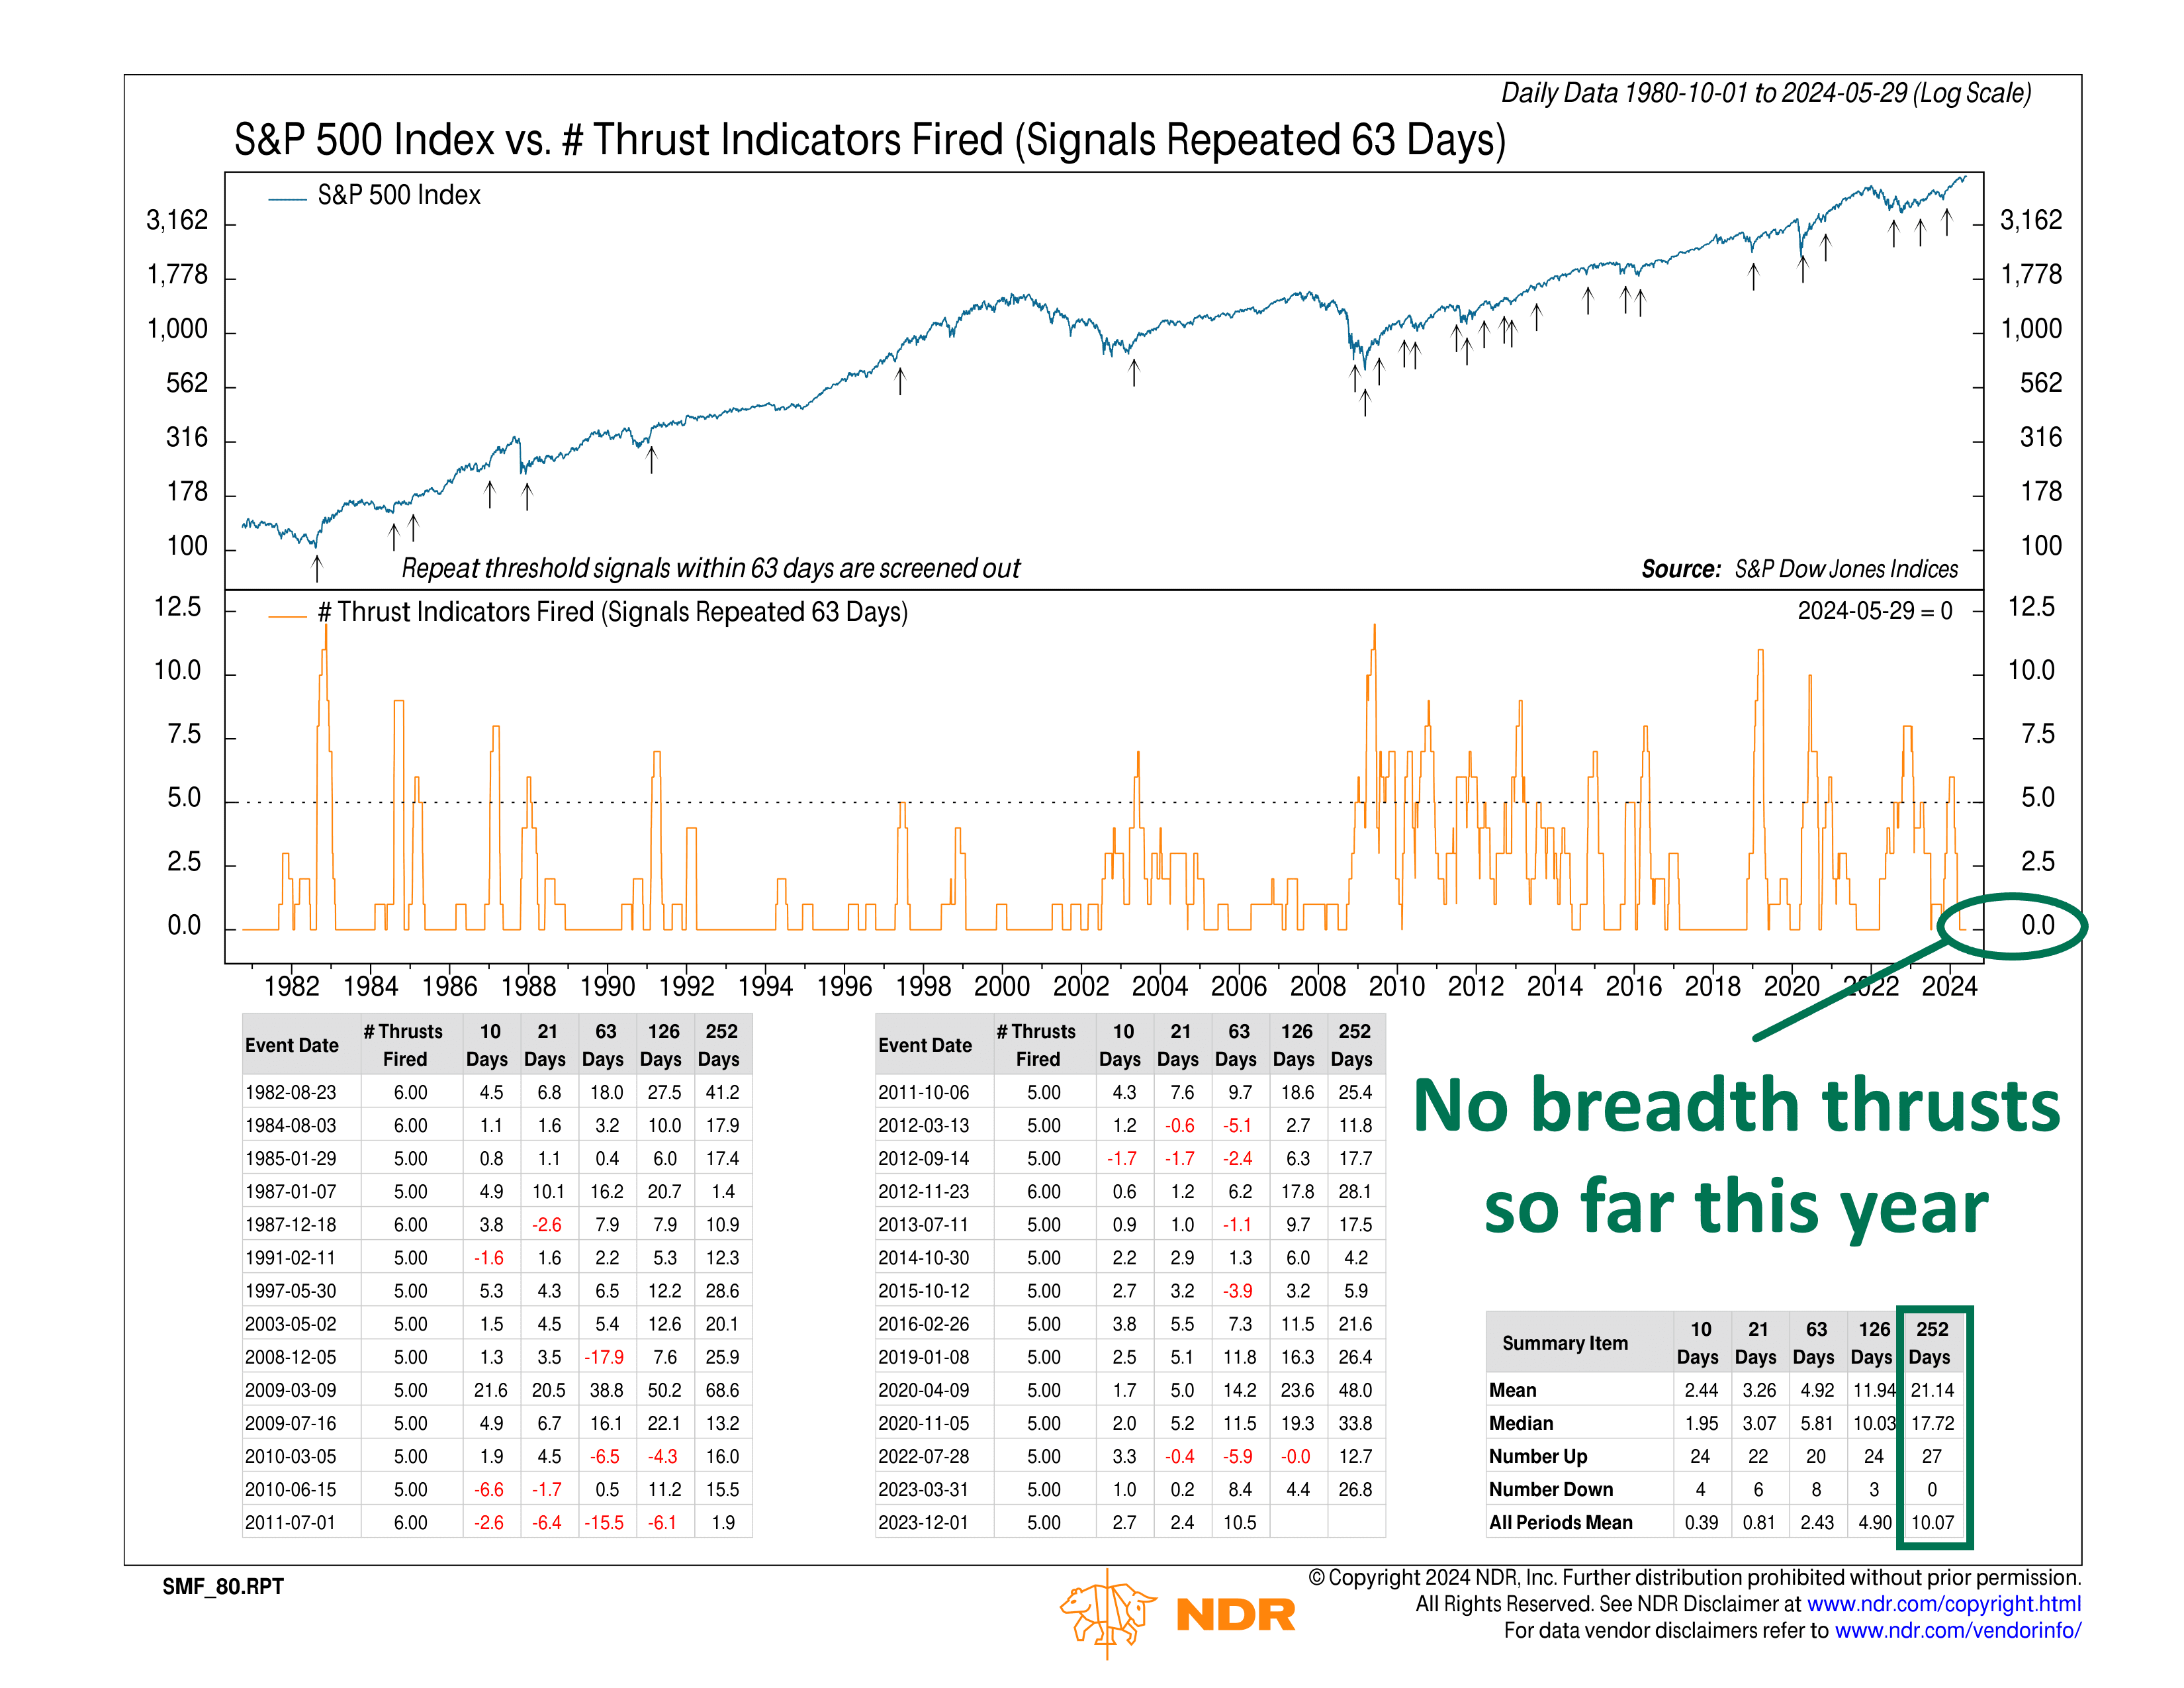
The orange line on the bottom clip of the chart shows how many of the 12 breadth thrust indicators have recently triggered positive signals. The key insight is that, historically, when 5 or more of them have fired, S&P 500 gains have been well above average up to a year later.
More specifically, if we look at the performance stats, we see that the average return for the S&P 500 a year after a positive signal from this indicator has been around 20% versus a 10% gain in all other periods. Even better, the market was up a year later in all 27 of those instances—a 100% hit rate.
The problem? The last signal came on 12/1/2023. And so far this year, none of the 12 breadth thrust indicators have fired. That doesn’t mean the rally is doomed, but it is noteworthy.
The bottom line? While not all rallies start with breadth thrusts, they have grown more common in recent years, so the lack of breadth thrusts this year is certainly a technical development worth monitoring.
This is intended for informational purposes only and should not be used as the primary basis for an investment decision. Consult an advisor for your personal situation.
Indices mentioned are unmanaged, do not incur fees, and cannot be invested into directly.
Past performance does not guarantee future results.
The S&P 500 Index, or Standard & Poor’s 500 Index, is a market-capitalization-weighted index of 500 leading publicly traded companies in the U.S
