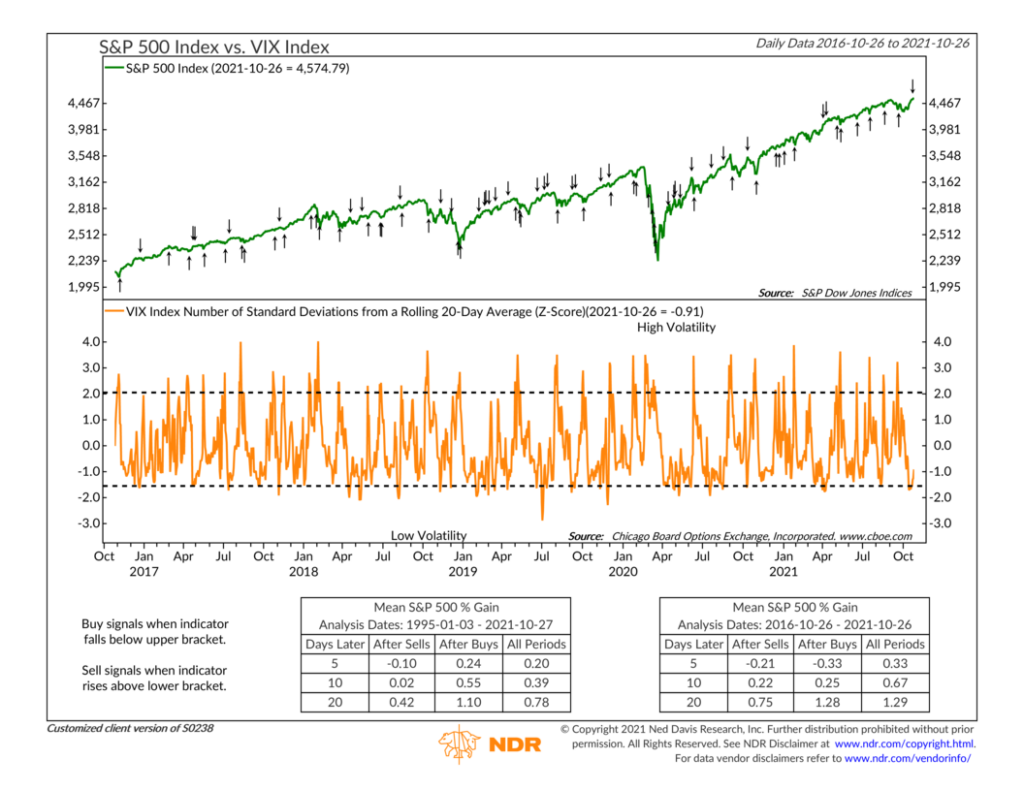
This week’s featured indicator focuses on the volatility of the volatility of the stock market. Yes, you read that right. Volatility of volatility. It sounds a bit weird. But more specifically, we are measuring the volatility of the VIX Index—aka the “Fear Gauge”—which itself is a measure of stock market volatility based on S&P option pricing.
What is volatility? The technical definition involves words like “degree of variation around a mean” and “standard deviation.” But I like to think of it as how much something wiggles around or fluctuates over time. Think of a drunk man walking home from a bar. The path he takes to get home will be quite erratic; it won’t be a straight line. This is volatility.
One way to measure volatility in the stock market is to look at implied volatility. When traders make bets on the stock market, they buy options that deliver payouts based on the performance of some underlying financial asset—like the S&P 500 Index. When demand for these options is high—maybe because traders expect the price of the S&P 500 to rise—the implied volatility of S&P 500 options goes up. This is what the VIX Index measures.
So, back to our indicator, we measure the volatility of the VIX Index by looking at its average level over the past 20 trading days and then comparing the current level to how many standard deviations it is from the average. This calculation is called a z-score, and it’s the orange line at the bottom of the chart.
Historically, we find that the best returns for the S&P 500 Index have come when the z-score rises above and then falls below the upper dashed line, which is two standard deviations from its 20-day average. After this occurs, stocks return an average of 1.10% 20 days later, versus a 0.78% gain in all periods.
Conversely, stock returns have been weaker when the z-score has fallen below and then risen back above the lower dashed line (-1.5 standard deviations from its 20-day average). Twenty days after a sell signal, the S&P 500 averages about a 0.42% gain.
These results confirm a general market maxim that high and falling volatility is good for stock market returns, whereas low and rising volatility is bad. This indicator just takes it one step further by measuring the volatility of volatility. This way, we can use that same maxim to measure stock market volatility and subsequent stock market returns regardless of the absolute level of the VIX.
This is intended for informational purposes only and should not be used as the primary basis for an investment decision. Consult an advisor for your personal situation.
Indices mentioned are unmanaged, do not incur fees, and cannot be invested into directly.
Past performance does not guarantee future results.
