The VIX Index is one of those esoteric things that financial professionals think about frequently but likely goes unnoticed by the average person. Therefore, in this week’s discussion, we’ll shed some light on the VIX Index and highlight why it’s one of our favorite tools for gauging stock market sentiment.
What is the VIX Index? Basically, it’s an index that measures the market’s expectations for future stock market volatility. Specifically, it measures 30-day stock market volatility using option pricing on the S&P 500 Index. When the VIX is high, it suggests investors expect larger price swings (volatility) in the S&P 500, meaning there is high uncertainty or fear in the market. Conversely, when the VIX is low, it means investors expect smaller price swings and, therefore, less uncertainty.
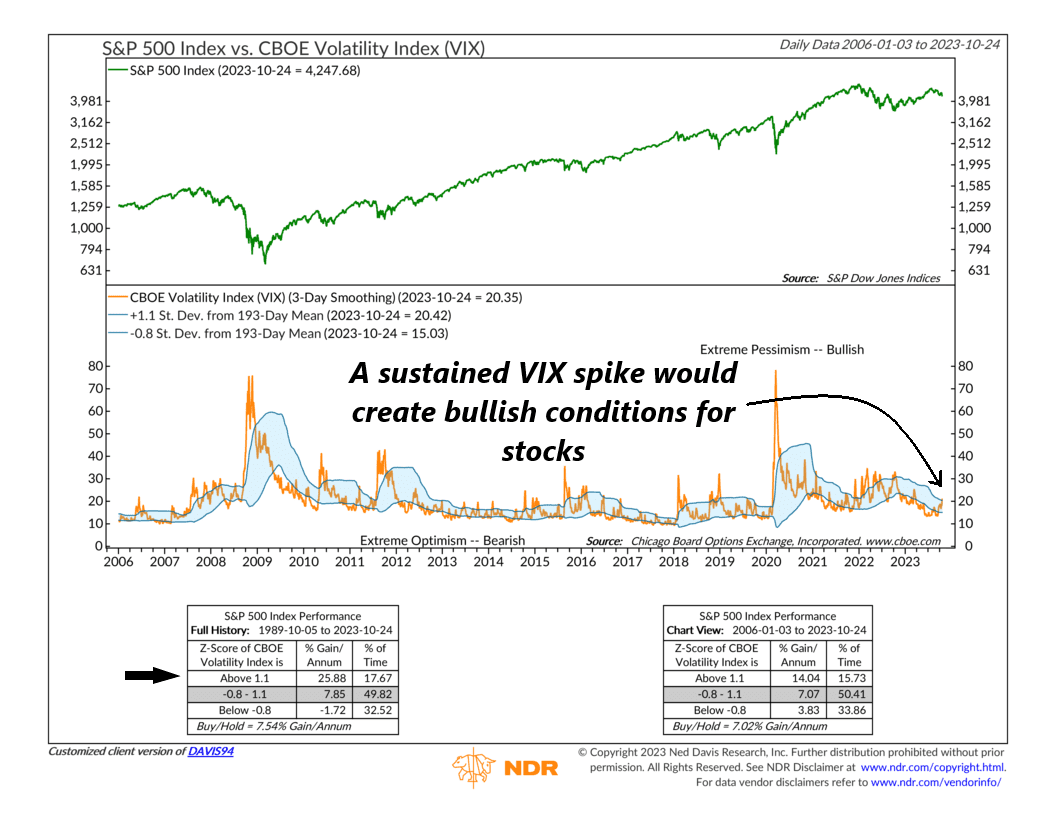
Looking at the chart, we have the S&P 500 Index (green line) in the top clip and the CBOE Volatility Index—or the VIX—as the orange line in the bottom clip. Just eyeballing it, you can easily see how massive spikes in the VIX tend to occur during major dips in the stock market. There’s a saying in financial markets that “volatility clusters,” and this seems to hold true as markets tend to decline significantly when there are clear catalysts—such as a financial crisis, a pandemic, or a war—that forces the VIX (or uncertainty) higher.
The thing about the VIX, though, is that it tends to revert to its long-run average of 20 eventually, even after a big spike. This means that large spikes in the VIX can lead to juicy buying opportunities.
For example, this indicator shows that a VIX spike above 1.1 standard deviations from its 193-day mean is precisely the surge needed to produce a strong buying opportunity for stocks. Historically, the S&P 500 has gained nearly 26% annualized when the VIX is trading above the upper bracket (1.1 standard deviations above average).
As I’ve highlighted on the chart, the recent downturn in the S&P 500 finally led the VIX to surge above 20 last Friday. That only lifted it back to its long-run average. But since volatility has been so muted this year, it actually equated to being more than 1.1 standard deviations above its 193-day mean—a bullish condition for stocks.
However, it’s since fallen a bit, putting it back in between its standard deviation bands.
Perhaps that was enough of a spike in “fear” to put a floor under the recent stock market downturn.
But if we look back in history, the best stock market returns have occurred when the VIX spikes meaningfully above that upper standard deviation band and maintains that elevated level for an extended period.
Therefore, the bottom line is that we think this will be something to keep an eye on in the weeks and months ahead, as a more sustained spike in the VIX could signal a more robust buying opportunity.
This is intended for informational purposes only and should not be used as the primary basis for an investment decision. Consult an advisor for your personal situation.
Indices mentioned are unmanaged, do not incur fees, and cannot be invested into directly.
Past performance does not guarantee future results.
The S&P 500 Index, or Standard & Poor’s 500 Index, is a market-capitalization-weighted index of 500 leading publicly traded companies in the U.S.
