“Downward revision” is one of the most common phrases you’ll hear during earnings season. It’s a polite way of saying: “We got a little too optimistic.”
This week’s indicator looks at how much those revisions are happening—and how much still might be left to go.
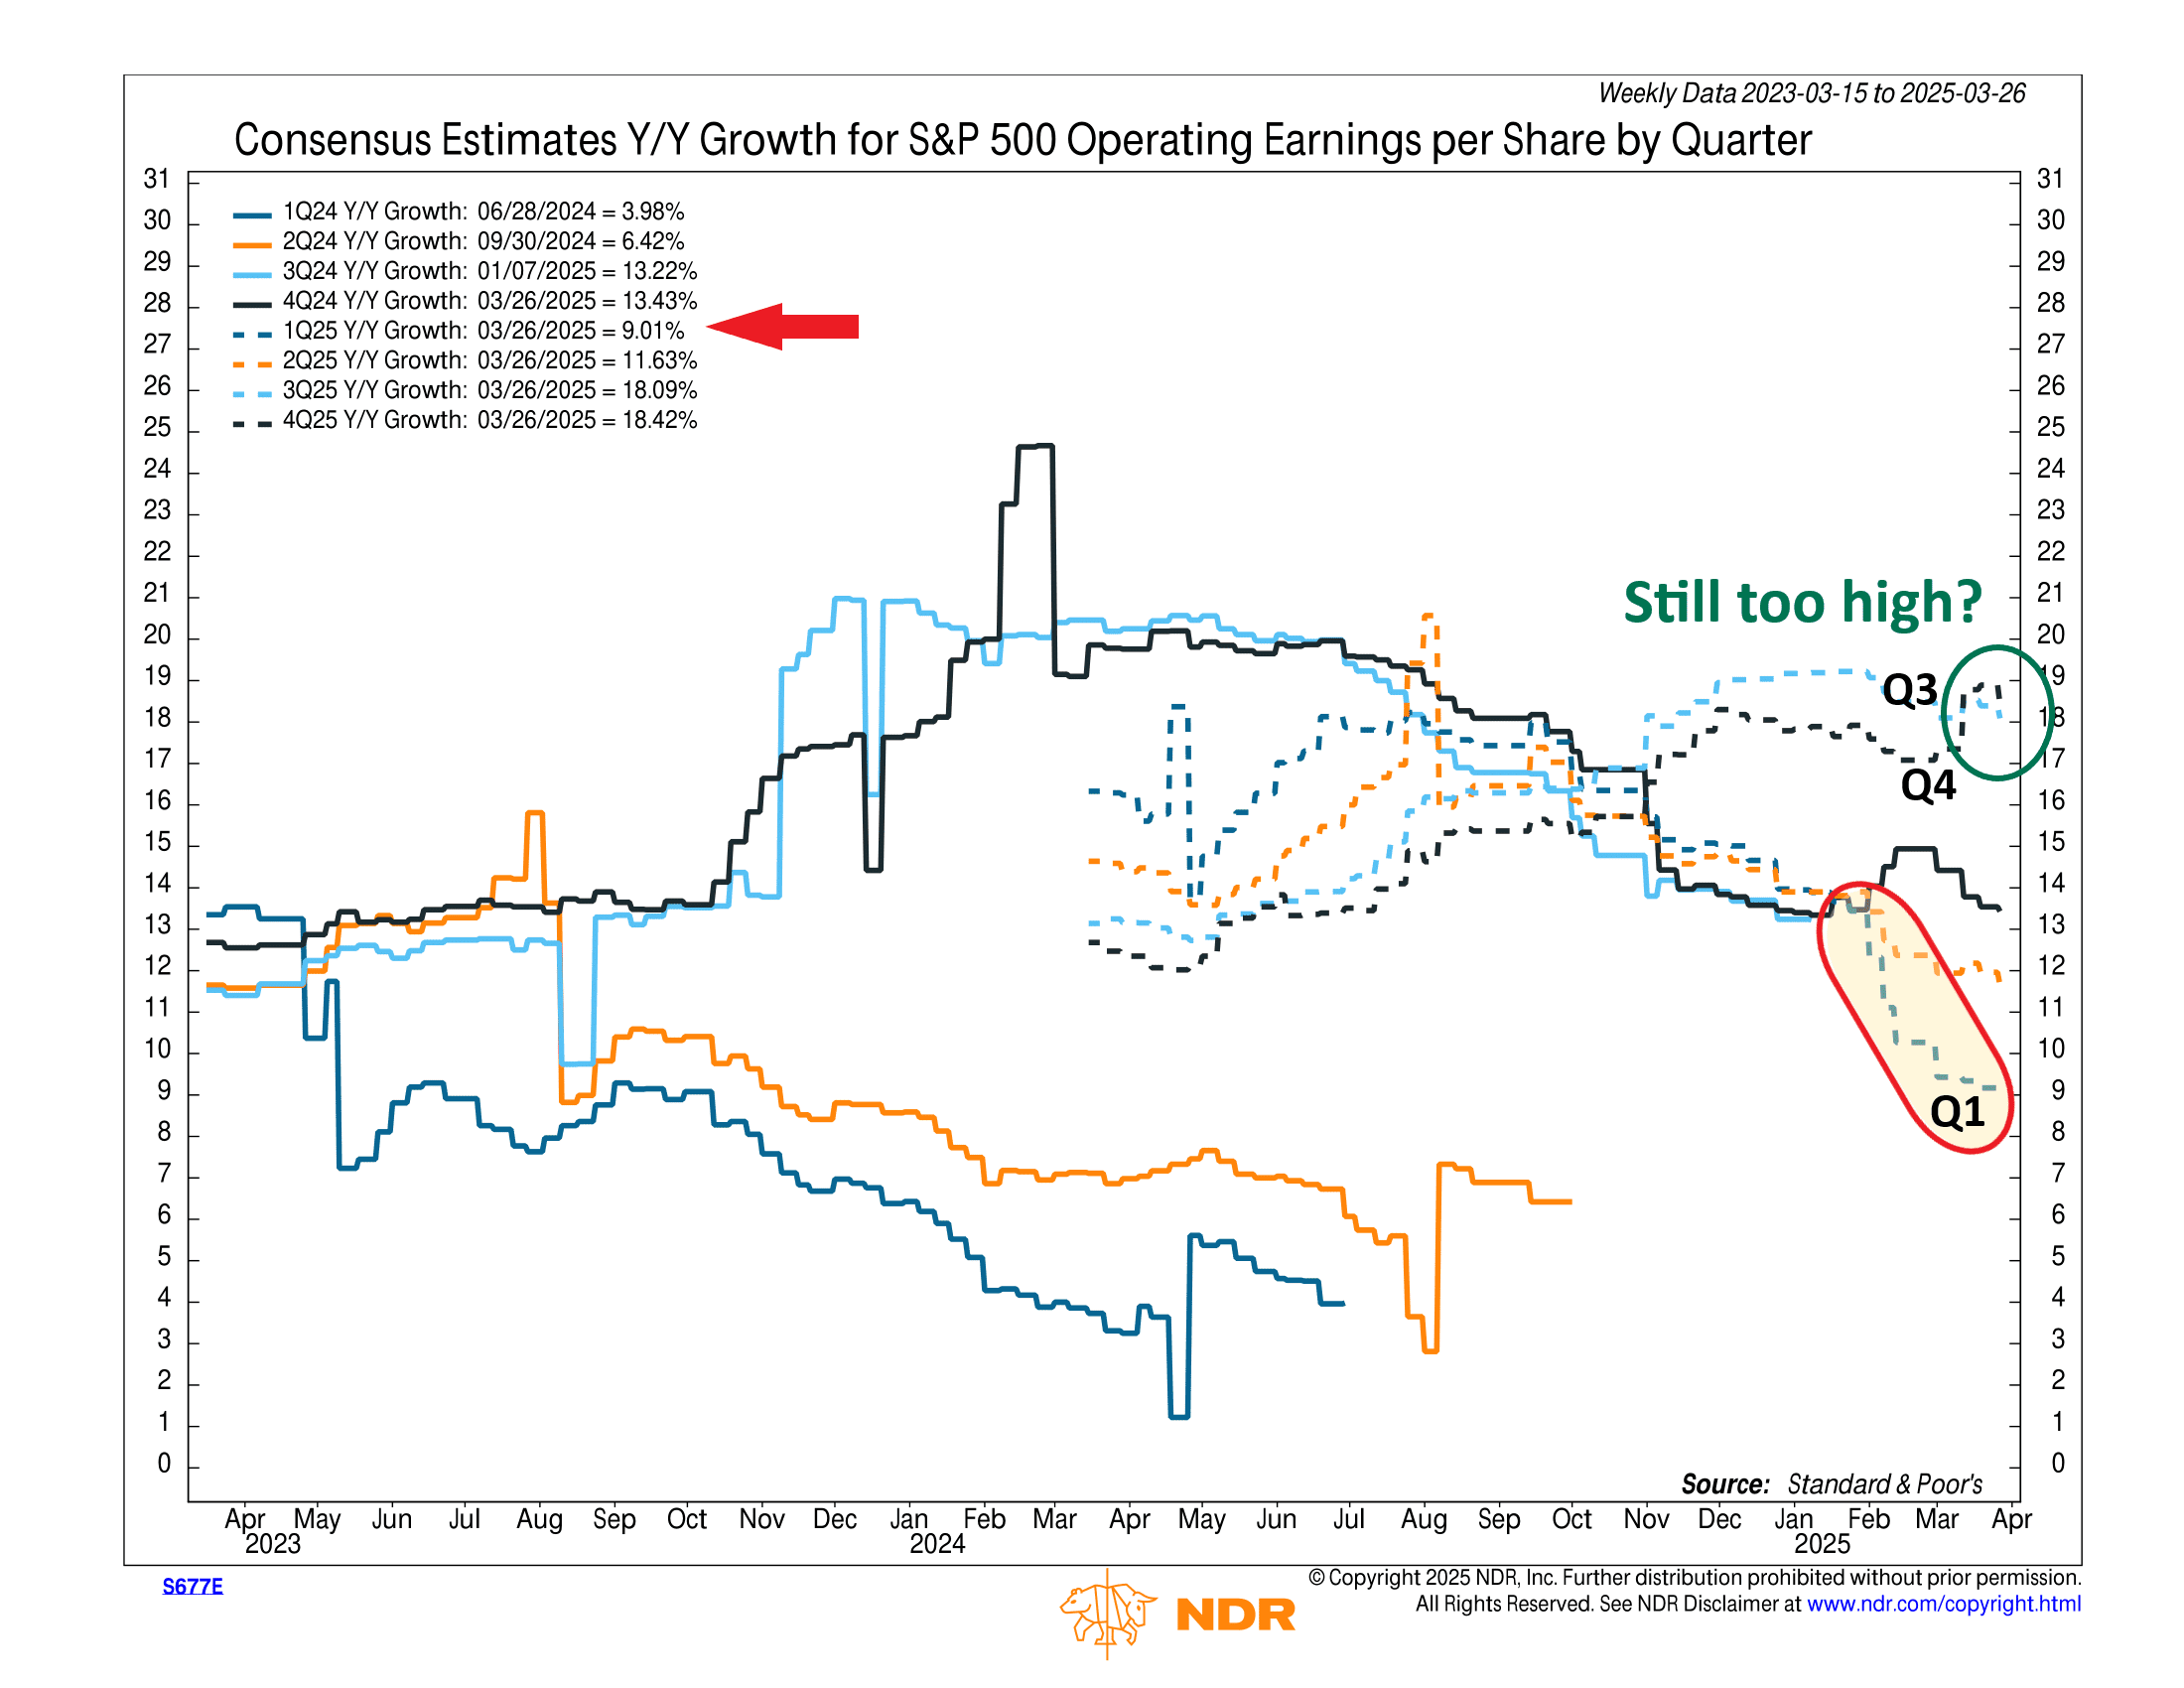
The chart below tracks consensus year-over-year earnings growth estimates for the S&P 500, broken out by quarter. While the lines may look busy, the message is simple: expectations are starting to come down, but only in one place—Q1 2025.
Q1 (blue dashed line) has dropped from a projected 14.0% growth at year-end to 9.17% as of March 26th. That’s a meaningful revision in just a few months.
The rest of the year—Q2 through Q4—has barely budged. Q3 and Q4 are still hovering near +19% growth. These are high bars, and they stand out against a backdrop of softening macro data and increasingly cautious corporate guidance.
Historically, downward revisions aren’t unusual. In fact, they’re the norm. Analysts tend to start the year with optimistic earnings forecasts and gradually trim them as new data rolls in. That pattern is beginning to play out in Q1, but it hasn’t made its way into the later quarters—at least not yet.
And that’s the risk.
If economic conditions weaken or margin pressures grow, there’s plenty of room for those elevated Q2–Q4 estimates to fall. That could weigh on market sentiment later in the year, especially if revisions accelerate.
For now, only Q1 is showing signs of recalibration. But with lofty expectations still baked into the rest of the year, the next round of downward revisions may just be a matter of time.
This is intended for informational purposes only and should not be used as the primary basis for an investment decision. Consult an advisor for your personal situation.
Indices mentioned are unmanaged, do not incur fees, and cannot be invested into directly.
Past performance does not guarantee future results.