The stock market is volatile. Any investor will tell you as much. But the volatility of the stock market isn’t constant; it changes over time. The level of volatility at any given moment is dependent on the environment and the current mood of investors. In a selloff, volatility tends to spike relative to its recent history, and at market tops, volatility tends to be low, a sign of widespread investor complacency.
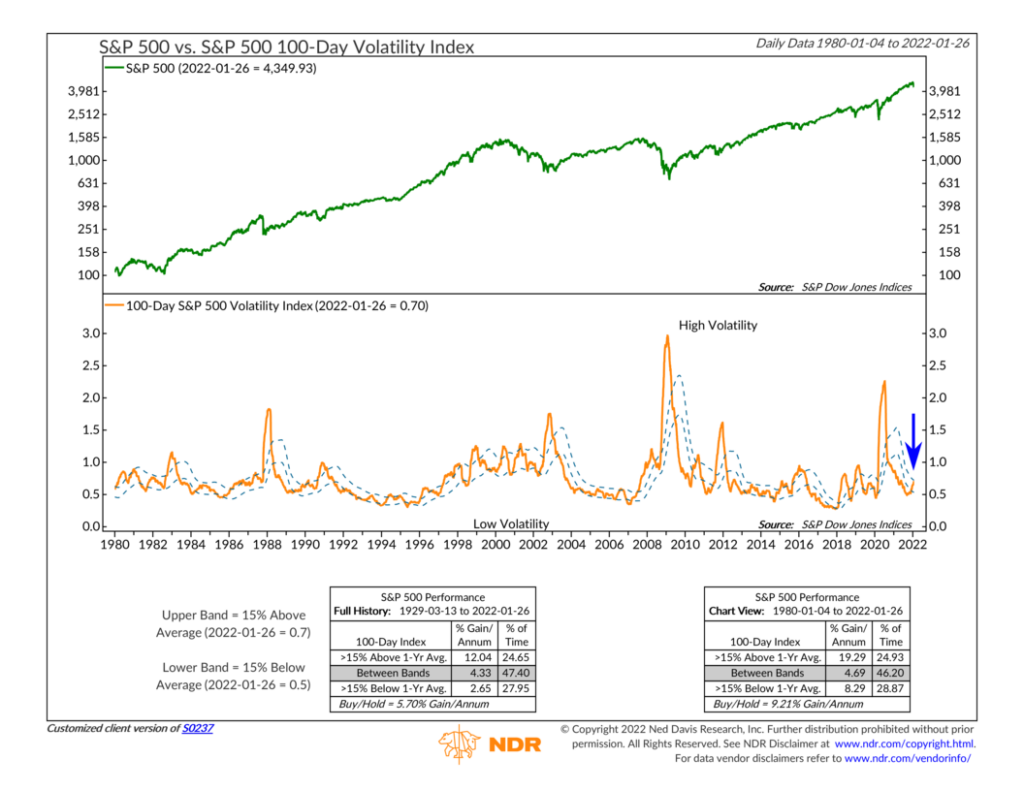
To quantify this phenomenon and determine what changing volatility can tell us about stock market returns, the indicator above calculates the average daily return of the S&P 500 stock market over the past 100 days. This results in a volatility index (orange line, bottom clip). So, if the volatility index has a reading of, let’s say, 0.8, that would mean that over the past 100 trading days, the S&P 500 had on average moved 0.8% (up or down) from its previous daily close.
To get the dashed lines (or bands), we calculate the one-year moving average of the volatility index to determine what normal volatility has been over the past year. And then, we add and subtract 15% to that average to get the bands. When the volatility index rises above the upper band or falls below the lower band, it’s a sign of extreme volatility.
So how does the S&P 500 stock market index (green line, top clip) perform during these periods of extreme volatility? Well, historically, high volatility readings have been associated with high returns, and low volatility readings have been associated with weak returns. Since 1929, when the volatility index has risen above the upper band, stocks have returned roughly 12% per year, on average. But when the volatility index has fallen below the lower band, returns have been just under 3% per year, on average.
Why? This is likely explained by the idea that the market tends to make a bottom and then turn higher when volatility reaches extreme heights and investor sentiment is at extremes. Conversely, investors tend to be complacent when volatility is low, sitting back and enjoying the easy gains, which tends to occur around market tops.
So, can this indicator help us out today?
The answer is yes. I’ve marked the most recent reading of the volatility index by the blue arrow on the far right of the chart. As you can see, it’s close to climbing above the upper band, denoting a level that is 15% higher than the average volatility of the S&P 500 over the past 100 days.
The stock market was down around 10% at one point earlier this week. So, the takeaway from this indicator is that we could be close to seeing a bottom soon as volatility rises to extreme levels. This is how things have generally played out in past market selloffs, and there’s good reason to believe that this time will probably be similar.
This is intended for informational purposes only and should not be used as the primary basis for an investment decision. Consult an advisor for your personal situation.
Indices mentioned are unmanaged, do not incur fees, and cannot be invested into directly.
Past performance does not guarantee future results.