OVERVIEW
The U.S. stock market started the week on a high note but closed in the red. The S&P 500 dropped 1.94%, the Dow slid 1.86%, and the Nasdaq tumbled 2.34%. Small caps fared the worst, losing about 2.8% by week’s end.
International markets also struggled. Stocks in developed markets declined 0.44%, while emerging markets fell 1.5%. Meanwhile, the U.S. dollar gained strength, rising 0.61%.
The bond market faced headwinds as the yield on the 10-year Treasury climbed to 4.77%, up from 4.6% earlier in the week, pushing bond prices down by roughly 0.6%.
Commodities, however, had a stellar week. Oil surged 3.5%, gold gained 2.9%, and corn jumped 4.4%. Real estate didn’t share the same momentum, plunging about 4.4%.
KEY CONSIDERATIONS
A Bit Peculiar – There’s something unusual going on in financial markets. Typically, when the Federal Reserve cuts interest rates, longer-term bond yields “do as they’re told” and go down along with short-term rates.
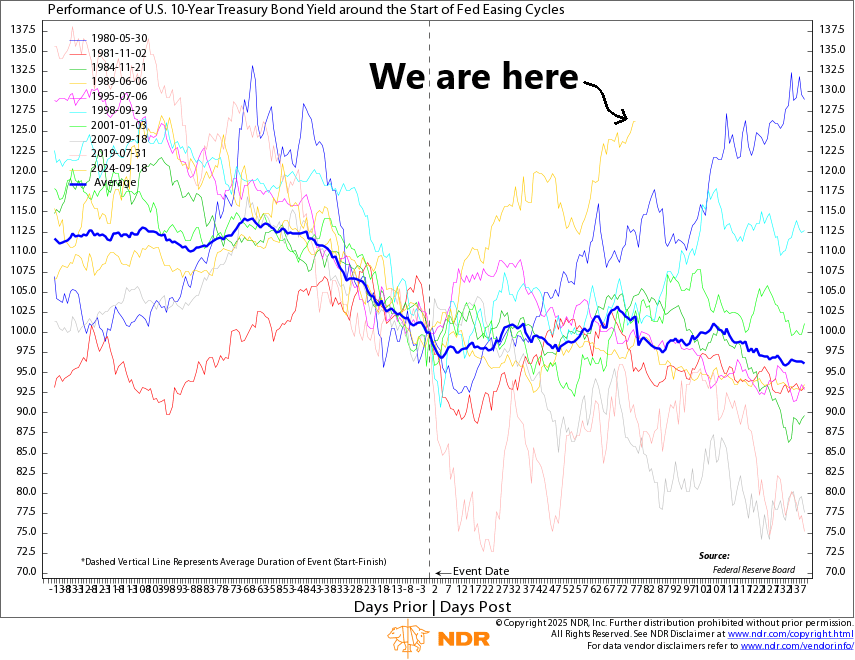
But that’s not what’s happening right now. Since September, the Fed has cut the Fed Funds Rate—the short-term lending rate they control—by 100 basis points. But over that same period, the 10-year Treasury rate has increased roughly 100 basis points.
That’s highly unusual. You could even say, a bit peculiar.
The following chart shows how the 10-year Treasury rate has historically behaved during past Fed rate-cutting cycles. The dark blue line represents the average—rates tend to decline as expected. But the yellow line? That’s our current cycle, where rates have climbed at an unprecedented pace in the first 80 days of easing.

In other words, the market isn’t playing ball with the Fed. It’s trying to tell us something. Is it fiscal worries? Waning foreign demand? Persistent inflation fears?
Whatever the cause, it’s starting to impact the stock market. Why? Because higher bond yields lower the equity risk premium, making stocks less attractive.
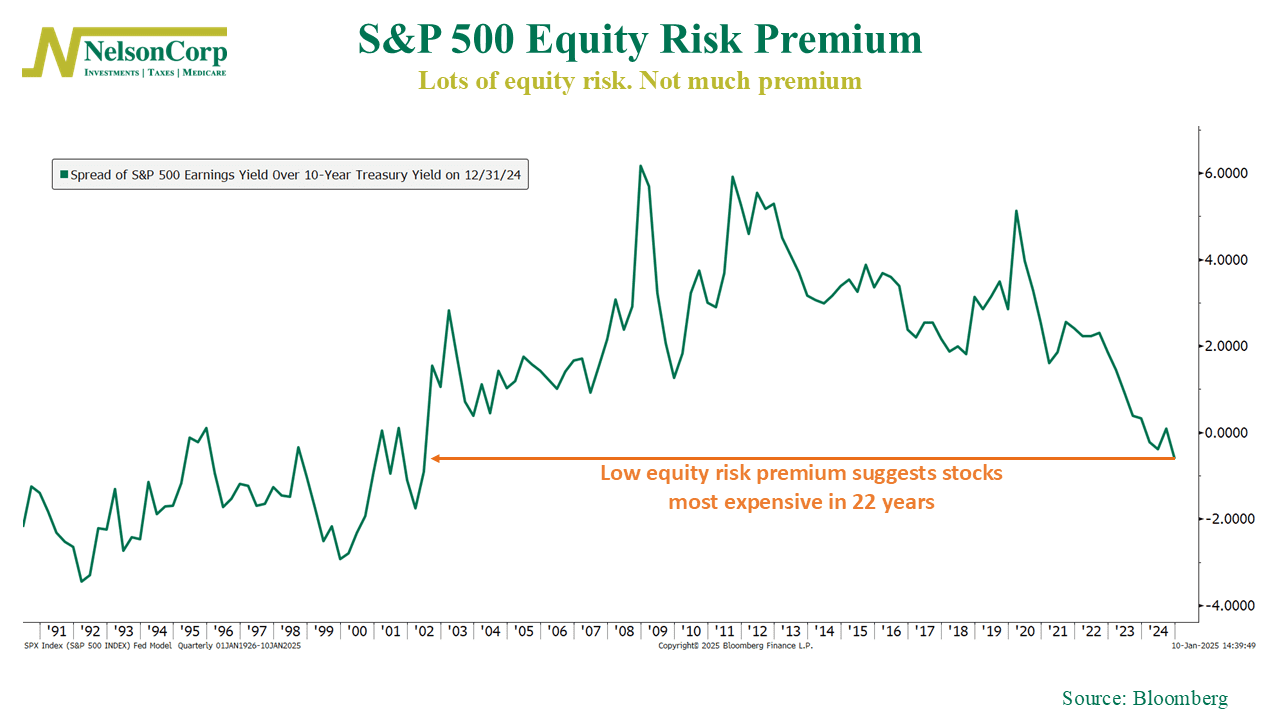
This next chart illustrates what I mean. It shows the famous Fed Model, which compares the earnings yield of stocks (the inverse of the price/earnings ratio) to bond yields. The higher equity yields are compared to bonds, the higher the line on the chart—and the cheaper stocks are. And vice versa.

But as you can see, the recent spike in bond yields has resulted in the equity risk premium going negative, reaching the lowest levels in roughly 22 years. In other words, stocks are way too expensive right now—and that likely explains why we’ve seen a selloff in recent weeks.
What’s an investor to do? Well, it doesn’t necessarily mean abandoning stocks entirely—that depends on your risk tolerance. But for most, it may be wise to reduce stock exposure and take advantage of the improved returns on bonds and decent short-term cash yields for the time being.
The bottom line? Smart investors know when to play offense and when to play defense. Right now, the bond market is sending a signal, and it’s worth paying attention.
This is intended for informational purposes only and should not be used as the primary basis for an investment decision. Consult an advisor for your personal situation.
Indices mentioned are unmanaged, do not incur fees, and cannot be invested into directly.
Past performance does not guarantee future results.
The S&P 500 Index, or Standard & Poor’s 500 Index, is a market-capitalization-weighted index of 500 leading publicly traded companies in the U.S.
