OVERVIEW
The U.S. stock market took a dip last week, with all three major indices ending in the red. The S&P 500 dropped 1.37%, the Dow fell 0.15%, and the Nasdaq decreased 1.5%. Growth stocks led the declines, down 1.51%, and smaller-capitalization stocks fell around 0.1%.
Foreign markets were down as well. Developed countries dipped 1.07%, and emerging markets dropped 1.11%. The U.S. dollar, on the other hand, strengthened by about 0.14%.
Bonds fell in price as the yield on the benchmark 10-year Treasury rate increased to 4.5% from 4.25% the week before. Overall, the core bond market fell about 0.88%.
Commodities didn’t fare any better, down around 2.16% for the week. Oil led the declines, down nearly 3%, with gold and corn also falling about 0.2% each. Real estate dipped 2.75%.
KEY CONSIDERATIONS
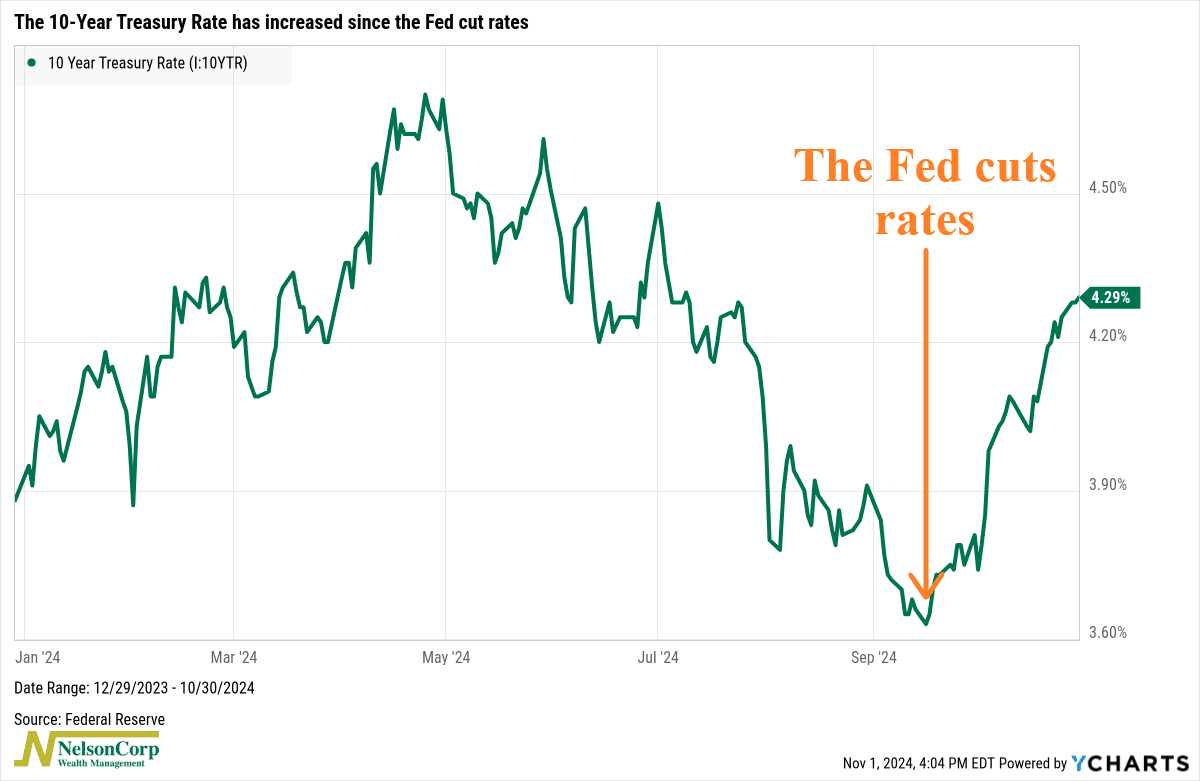
Are Rates a Problem? – It’s funny. On September 18th, the Federal Reserve decided to cut their benchmark interest rate—the Fed Funds rate—by 50 basis points. And what did long-term rates do? They went up!
Here’s the 10-year Treasury yield:

Yeah, that’s financial markets for you. Sometimes they move in ways you wouldn’t expect.
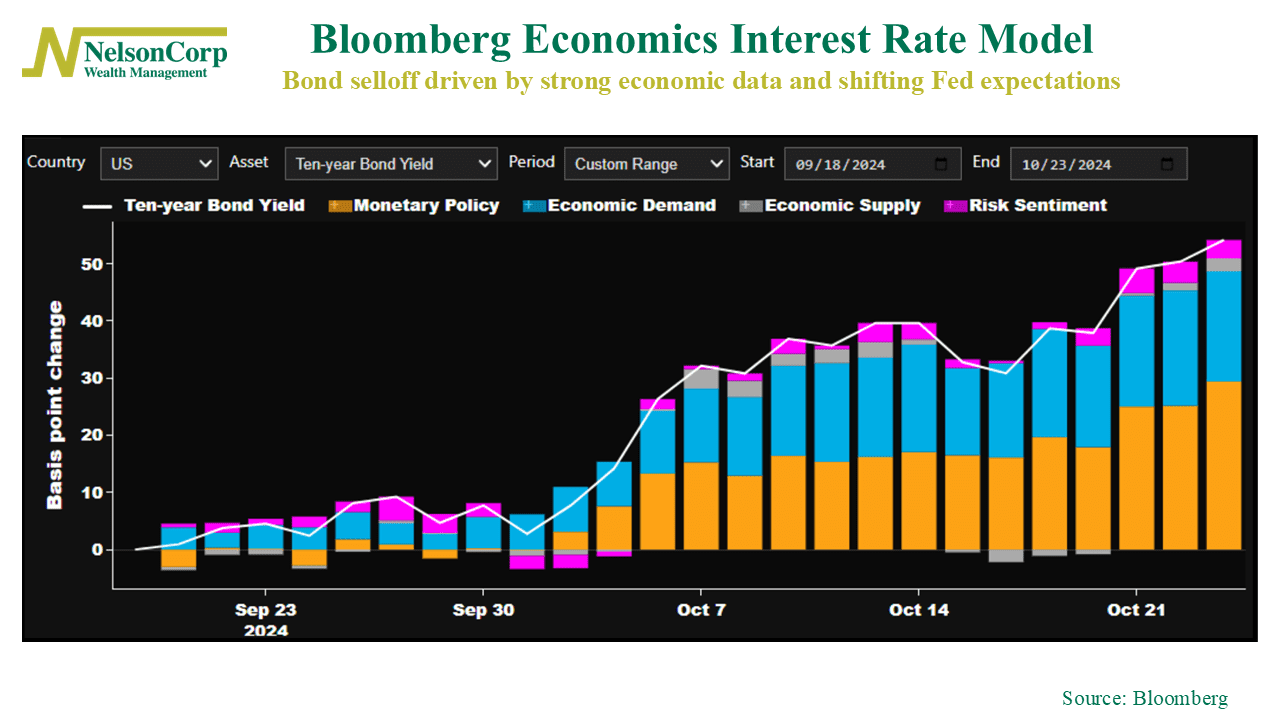
However, there’s an explanation for the bond yield surge. This next chart is a model from Bloomberg Economics showing that the bond move is all about the economy—and a change in Fed expectations.

The model decomposes the drivers for the movements in bond yields into Monetary Policy, Economic Demand, Economic Supply, and Risk Sentiment. Increases in any of these factors will drive interest rates higher.
Since the Fed meeting, the 10-year yield has increased roughly 50 basis points (0.5 percentage points). The model shows that about 30 basis points can be attributed to the monetary policy factor, and another 19 basis points can be explained by economic demand, or better data. Risk sentiment has made a small contribution, as well.
In other words, rates have risen mostly because of stronger economic data and reduced expectations for further aggressive rate cuts.
The takeaway, therefore, is that the rise in rates is probably not a problem for the stock market. If the Fed doesn’t need to aggressively cut rates, that likely means the economy is doing just fine—and that’s exactly what the incoming economic data is telling us.
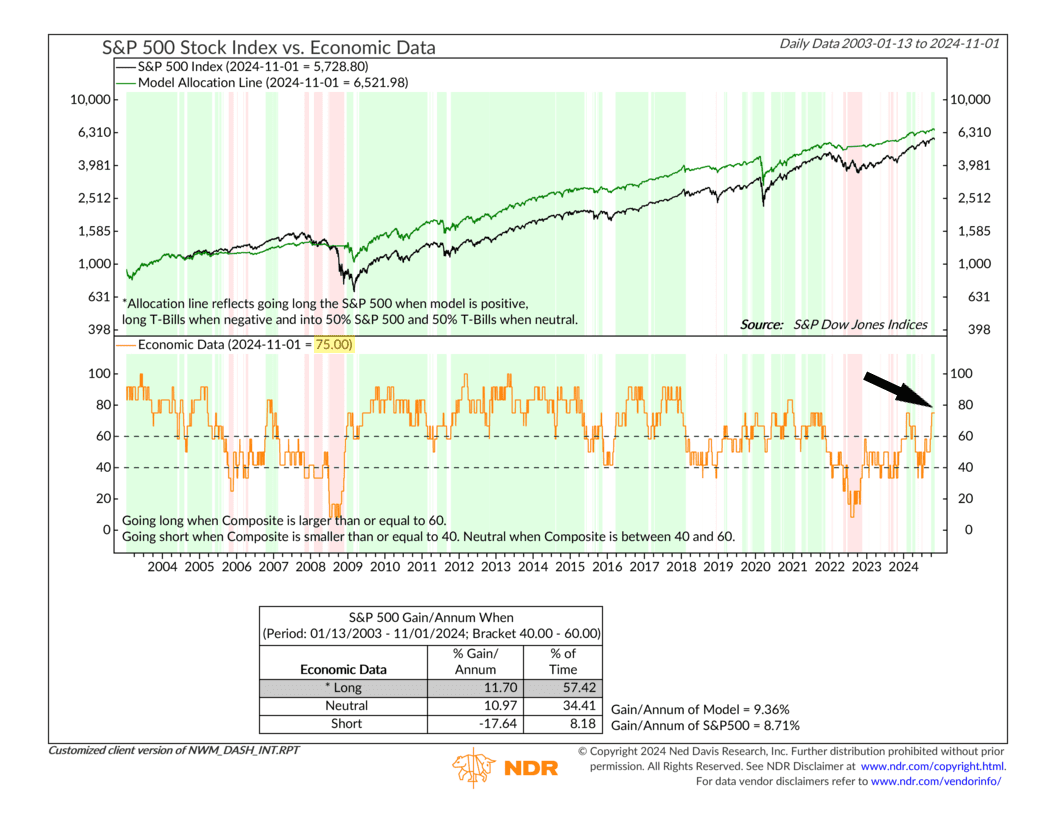
Do our indicators agree? For the most part, yes. According to our Interest Rate model, 75% of our interest rate focused indicators are in a bullish state for the stock market. And this has helped push our Economic Data model, shown below, to a similar 75% bullish reading.

So, piece this all together, and the weight of the evidence suggests that the market environment remains favorable for equity returns.
This is intended for informational purposes only and should not be used as the primary basis for an investment decision. Consult an advisor for your personal situation.
Indices mentioned are unmanaged, do not incur fees, and cannot be invested into directly.
Past performance does not guarantee future results.
The S&P 500 Index, or Standard & Poor’s 500 Index, is a market-capitalization-weighted index of 500 leading publicly traded companies in the U.S.
