OVERVIEW
Last week, the stock market saw a sharp decline across the board. The Dow dropped 2.39%, the S&P 500 fell 3.28%, and the Nasdaq took a steep hit, plummeting 4.71%. Small-cap stocks fared the worst, sliding 5.7%.
International markets weren’t spared either. Stocks in developed nations fell by 2.87%, while emerging markets dipped 2.28%.
Meanwhile, bonds outperformed as the yield on the 10-year Treasury dropped to 3.7%, boosting the aggregate bond market by 1.3%.
Real estate saw a slight decline, down 0.2% for the week. Commodities also suffered, down 2.37% overall, with oil plunging 7.28% and gold staying relatively flat. The U.S. dollar saw a slight weakening, slipping 0.04%.
KEY CONSIDERATIONS
Bad News is Bad News – The stock market can be a real head-scratcher. Sometimes, it’s straightforward: good news is good news, and bad news is bad news.
But other times, the reaction seems upside-down. Good news might turn out bad, or bad news could unexpectedly boost the market. Often, this flip happens because of external factors, like the central bank’s next move. Or because the market is always looking forward to what’s coming next.
I get it—it’s confusing.
Last week, though, the market followed the usual script: bad news was indeed bad news. The S&P 500 Index, our go-to gauge for U.S. stock performance, hit a rough patch and fell over 3%. This decline was largely due to a series of disappointing economic data points.
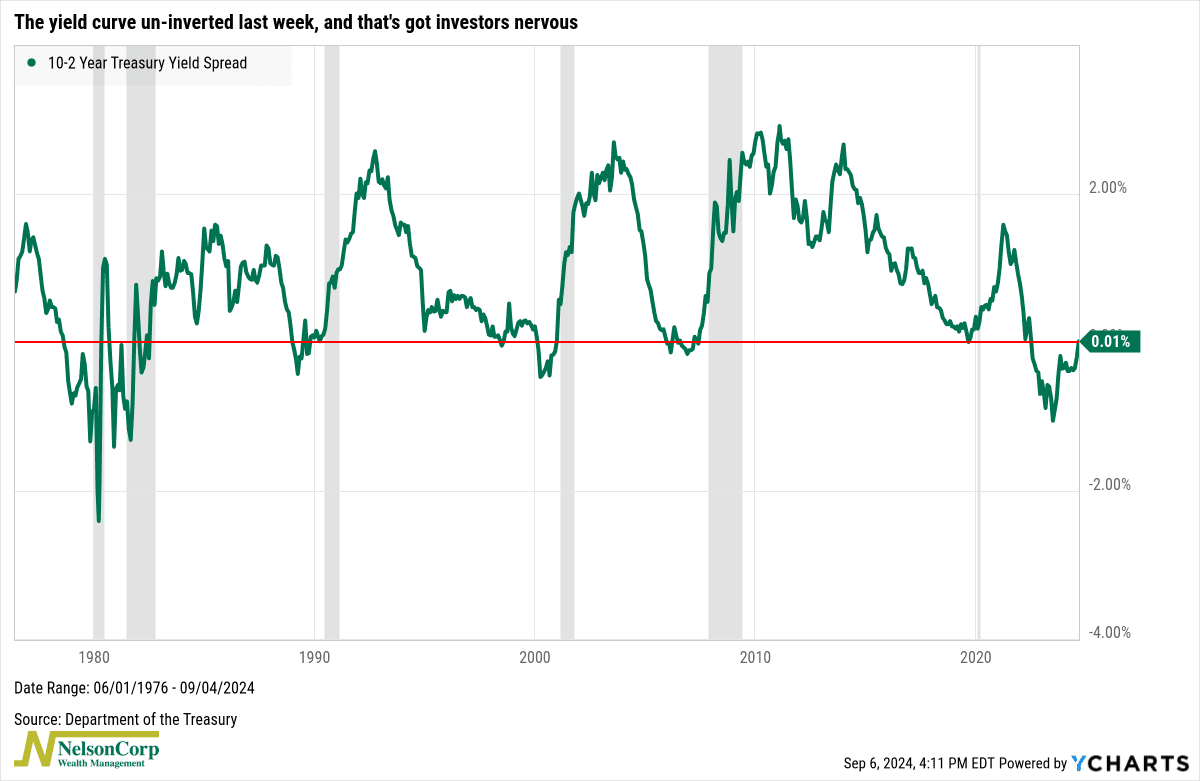
Take the yield curve, for instance. As we noted in our Indicator Insights post, the yield curve—the gap between the 2-year and 10-year Treasury rates—un-inverted last week. While this means the curve is now normal and sloping upward, historically, this shift has often been a red flag for markets, suggesting a potential recession may be near.

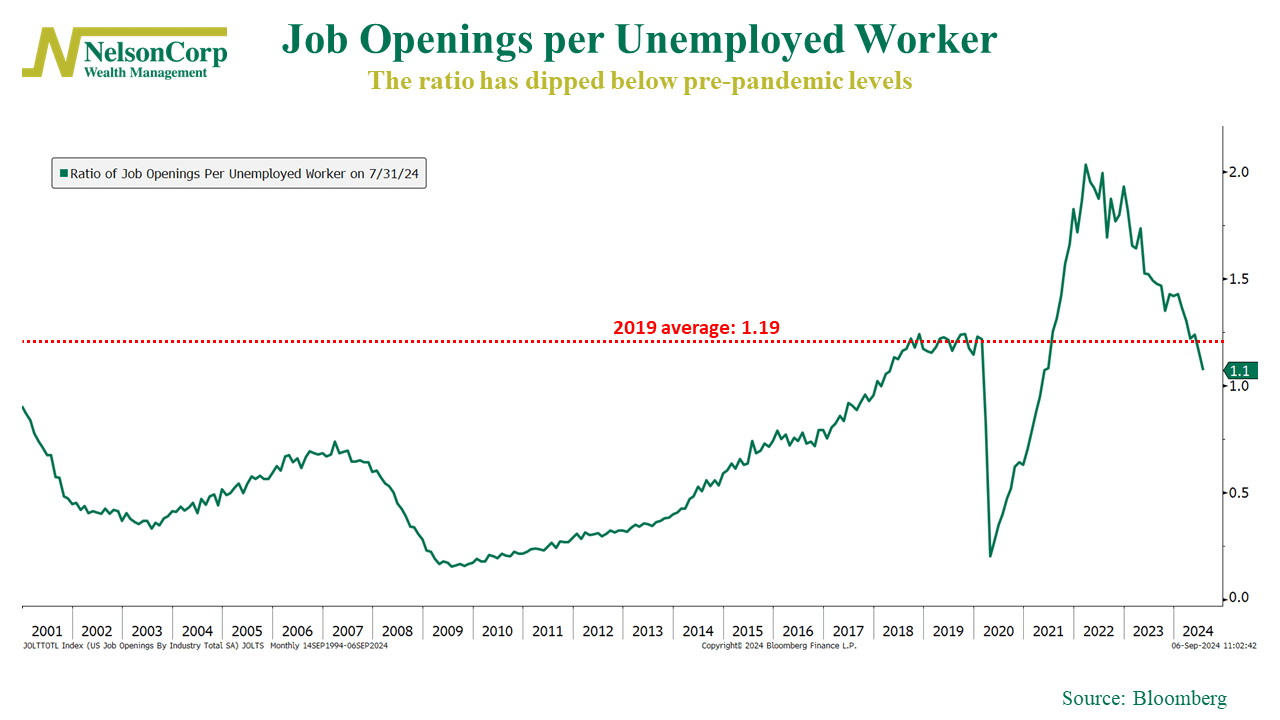
This is why the week’s economic data had investors on edge. For example, the JOLTS report, highlighted in our Chart of the Week post, showed a decline in the ratio of job openings to unemployed workers, signaling a softer labor market.

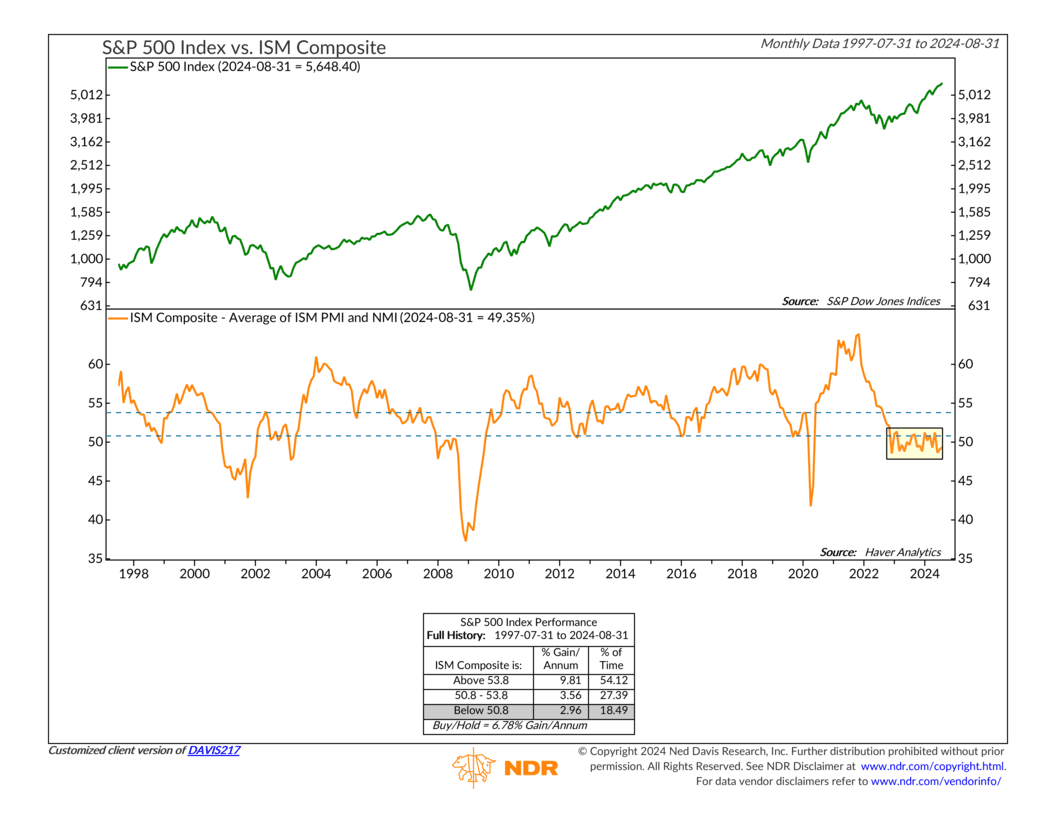
And then there’s the ISM Purchasing Manager’s Index (PMI) and the ISM Non-Manufacturing Index (NMI), both of which continue to be sluggish. Our indicator below shows that a composite of these indices has remained in the lower bearish zone for nearly a year—a pattern that has historically weighed on stock returns.

So basically, what’s going on is that the economy and financial markets are undergoing a transition. We’ve moved from a phase of high inflation and strong growth to a period of lower inflation and, hopefully, only slightly slower growth, largely due to the Fed’s aggressive monetary policies.
It’s all a part of the adjustment process as the economy recalibrates to these new conditions. In this sort of environment, we should expect some market volatility as things get sorted out.
This is intended for informational purposes only and should not be used as the primary basis for an investment decision. Consult an advisor for your personal situation.
Indices mentioned are unmanaged, do not incur fees, and cannot be invested into directly.
Past performance does not guarantee future results.
The S&P 500 Index, or Standard & Poor’s 500 Index, is a market-capitalization-weighted index of 500 leading publicly traded companies in the U.S.
