OVERVIEW
The U.S. stock market took another step back last week, as all three major indices posted losses. The S&P 500 edged lower by 0.48%, the Dow slipped 0.6%, and the Nasdaq dropped 0.51%.
Growth stocks weren’t spared, falling 0.55%, but value stocks bucked the trend with a modest 0.07% gain. Meanwhile, small caps managed to shine, climbing 0.4% and standing out as a rare bright spot in an otherwise muted market.
Global markets followed suit, with developed markets retreating 0.9% and emerging markets down 0.89%, as the U.S. dollar surged more than 1%, putting pressure on international assets.
On the flip side, bonds found some love from investors. The yield on the 10-year Treasury fell to around 4.6%, giving long-term bonds a 0.16% lift. Real estate had an impressive week, gaining 0.8%, and commodities quietly added about 0.3%. Oil stole the spotlight, surging 5.5%, while gold shone brighter with a 0.87% rise. Even as oil and gold glittered, corn took a step back, dipping 0.72%.
It was a week where caution ruled equities, but pockets of strength emerged in other corners of the market.
KEY CONSIDERATIONS
Beneath the GDP Gloss – 2024 was an interesting year for the economy. Sure, if we look at GDP numbers, shown below, it was a pretty uneventful year.
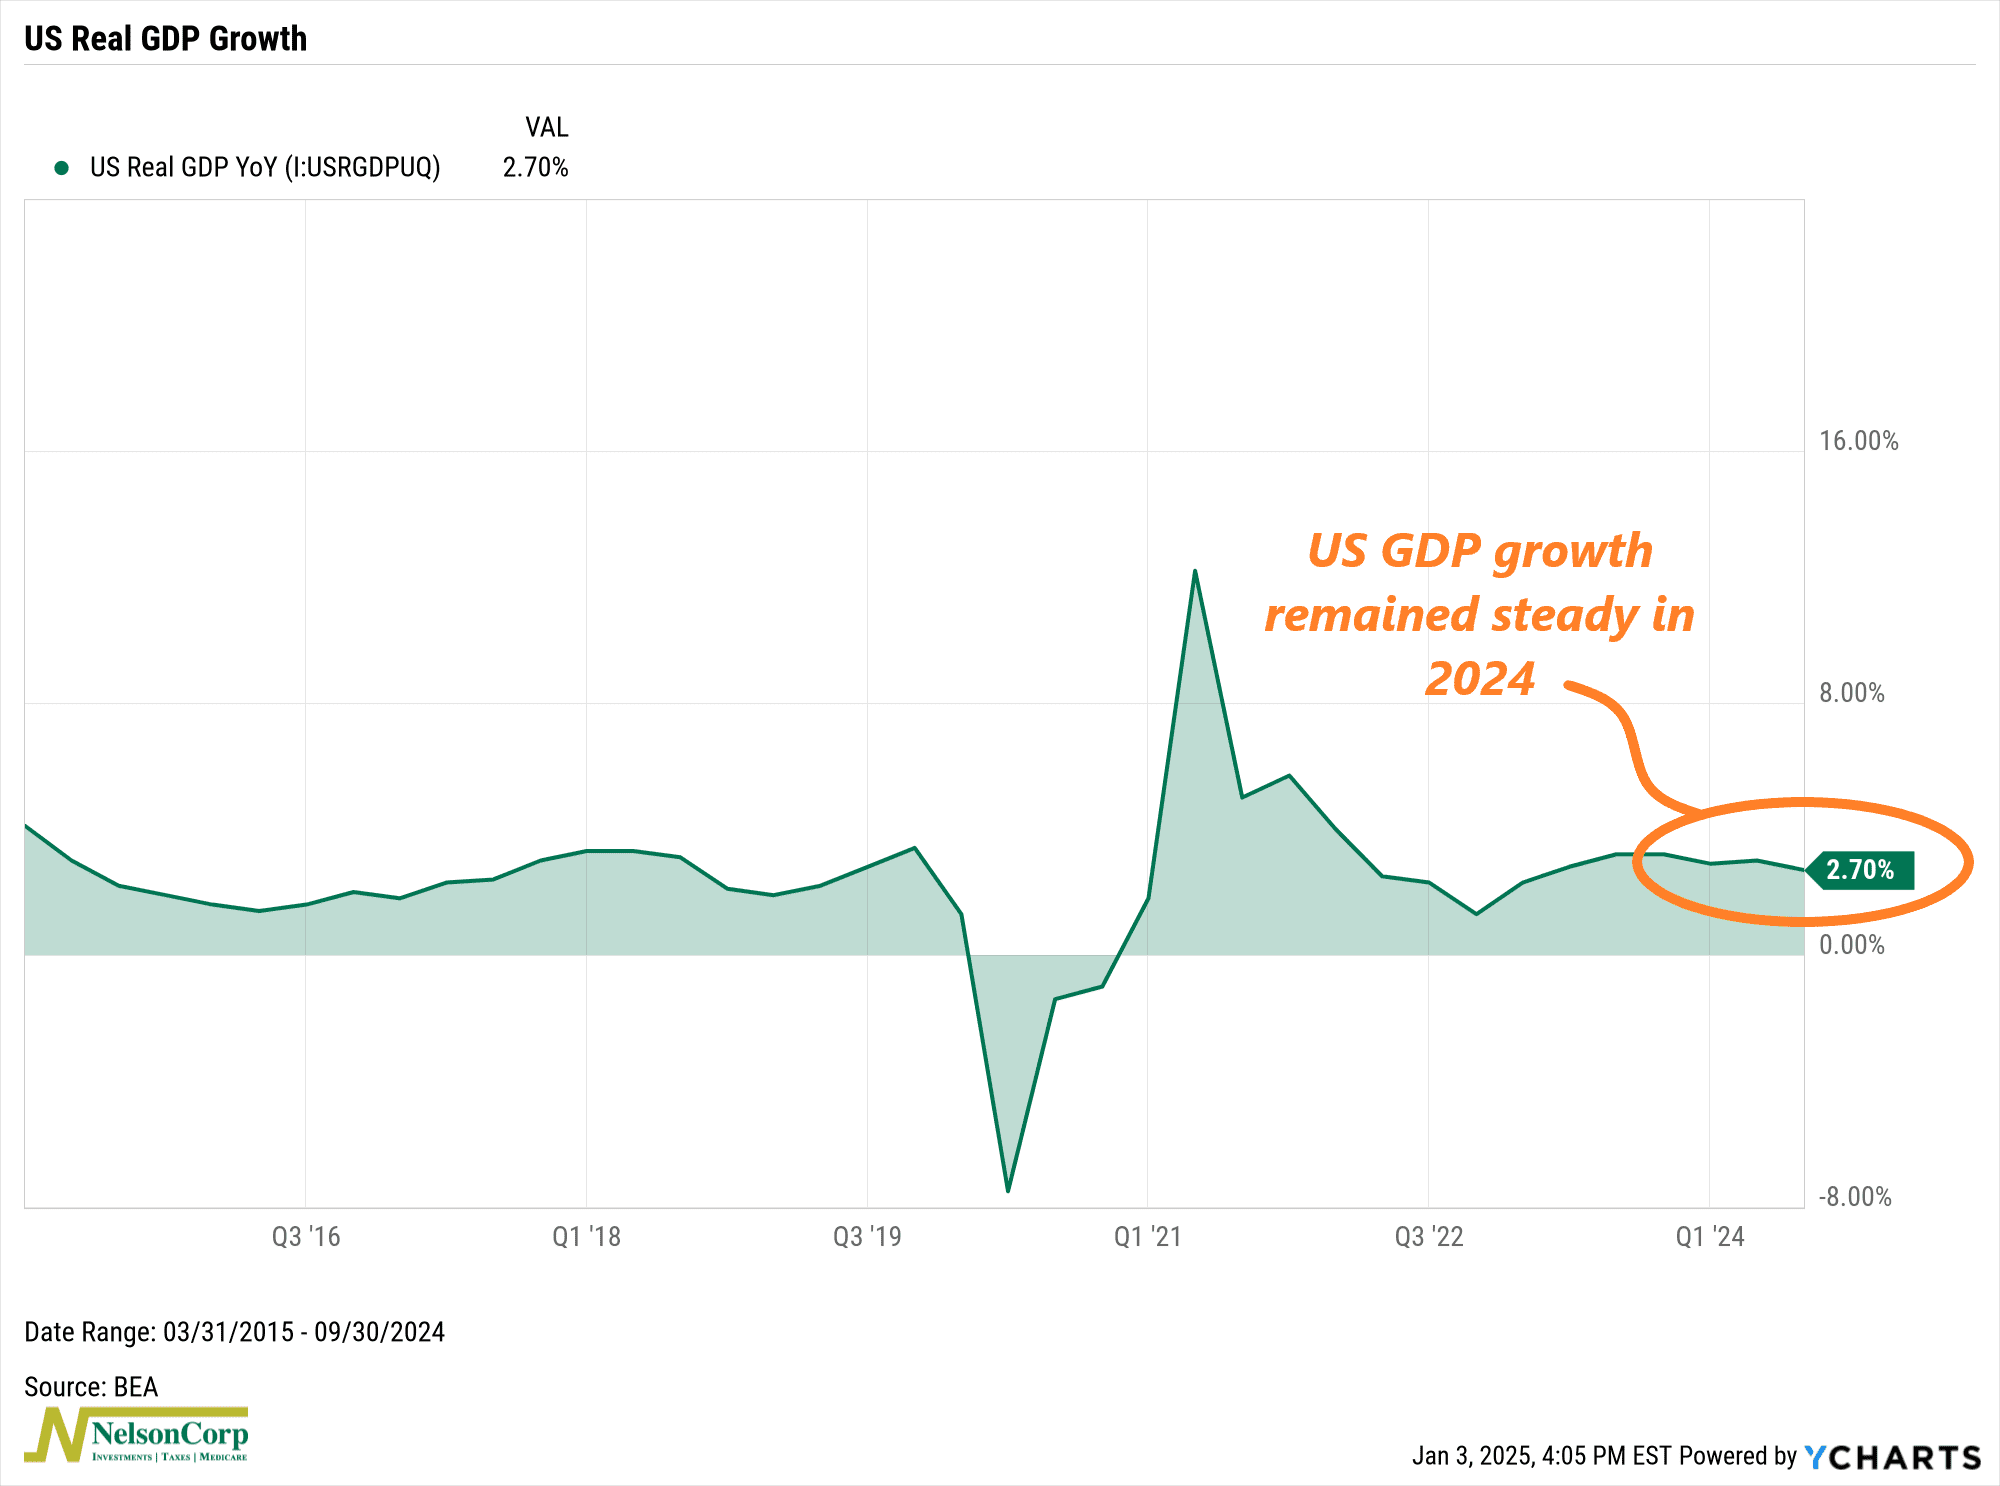
The economy, as measured by Gross Domestic Product, maintained steady growth at around 3% on a real year-over-year basis. Pretty normal stuff, right?
But dig a little deeper, and a different narrative emerges. When we focus on the economic activity indicators that most influence stock market returns, the story becomes much more volatile. We call these economic activity indicators, and we track them in a composite of six key indicators, shown below.
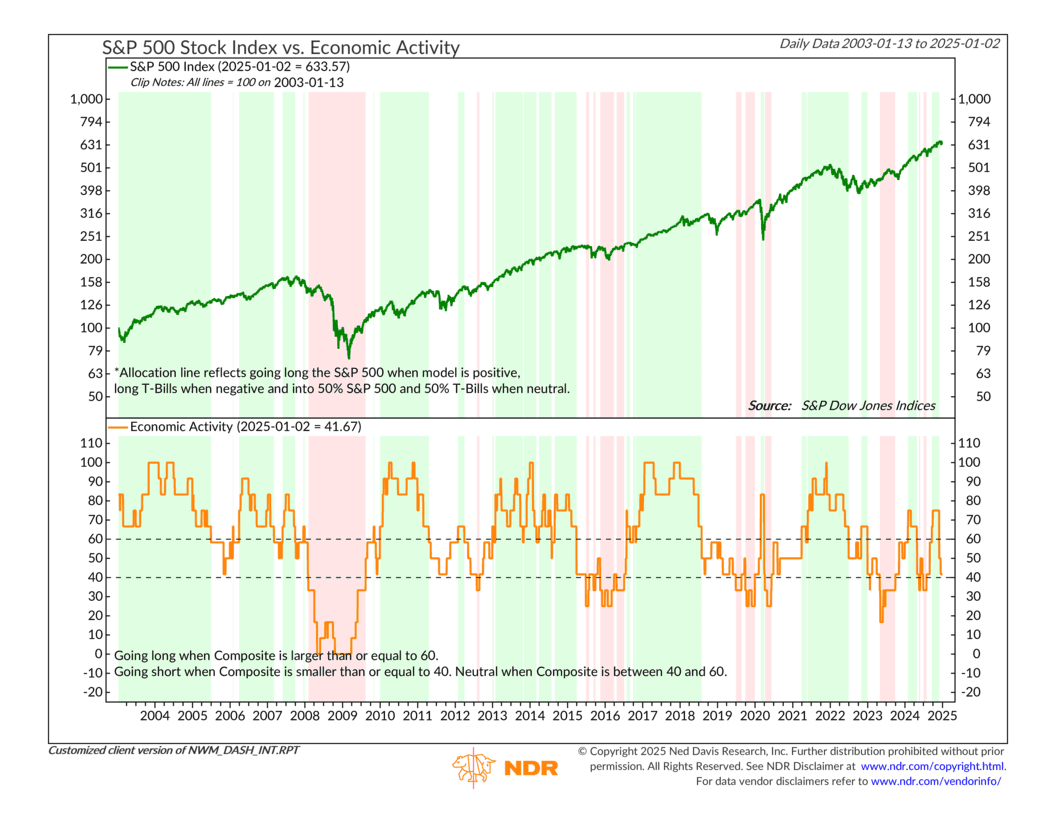
As you can see, the year began with our composite indicators firmly in the green. Then, midyear brought a sharp dip into negative territory, followed by a resurgence in the fall. Finally, December delivered a steep plunge, marking a chaotic end to the year.
This type of volatility is unusual for these indicators, which typically trend steadily in one direction, providing a consistent backdrop for our stock market risk models. But not in 2024.
So, this week, I want to dig a little deeper into the most recent plunge in economic activity, as it was a key ingredient to our overall model’s recent deterioration.
The best place to start is the following indicator, showing the Citigroup U.S. Economic Surprise Index. This indicator measures whether economic data is coming in better or worse than analysts’ expectations.
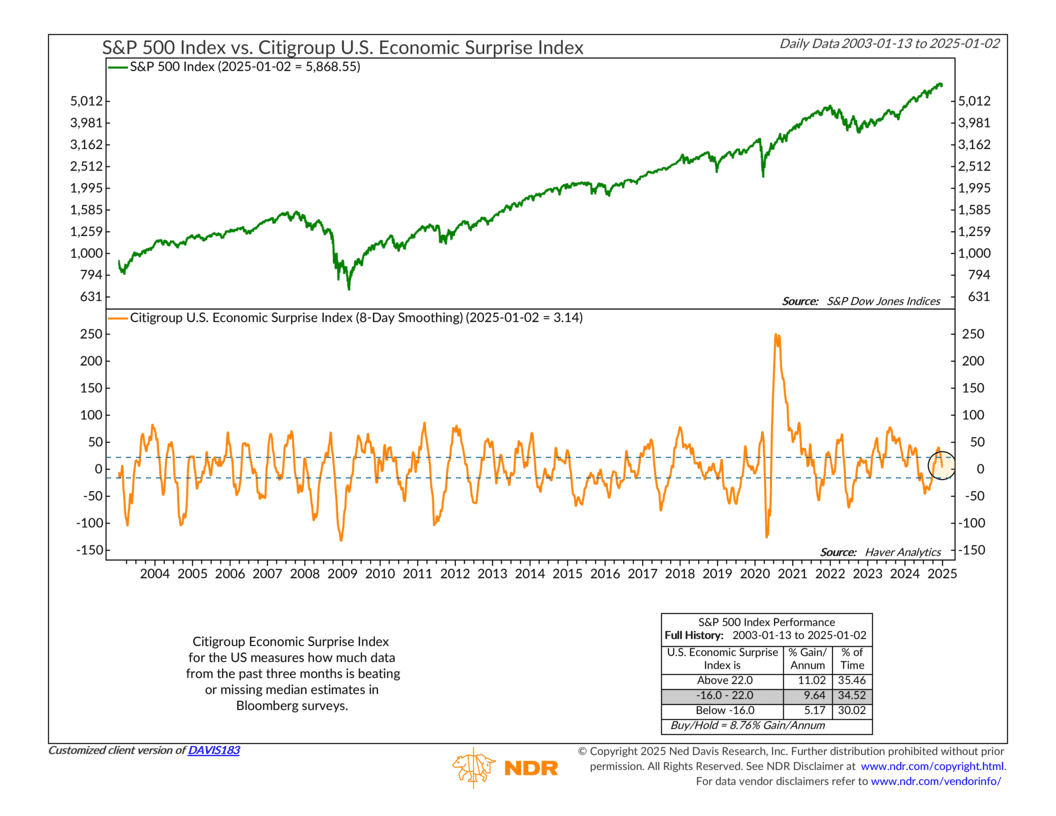
As you can see, it too surged into positive territory in the fall, but as has since reversed to essentially zero. In other words, incoming economic data is no longer surprising to the upside.
This next indicator is partly to blame for the recent lack of upside surprises. It tracks the ISM Composite—an average of the ISM PMI and NMI—which measures economic activity in the manufacturing and non-manufacturing sectors of the economy.
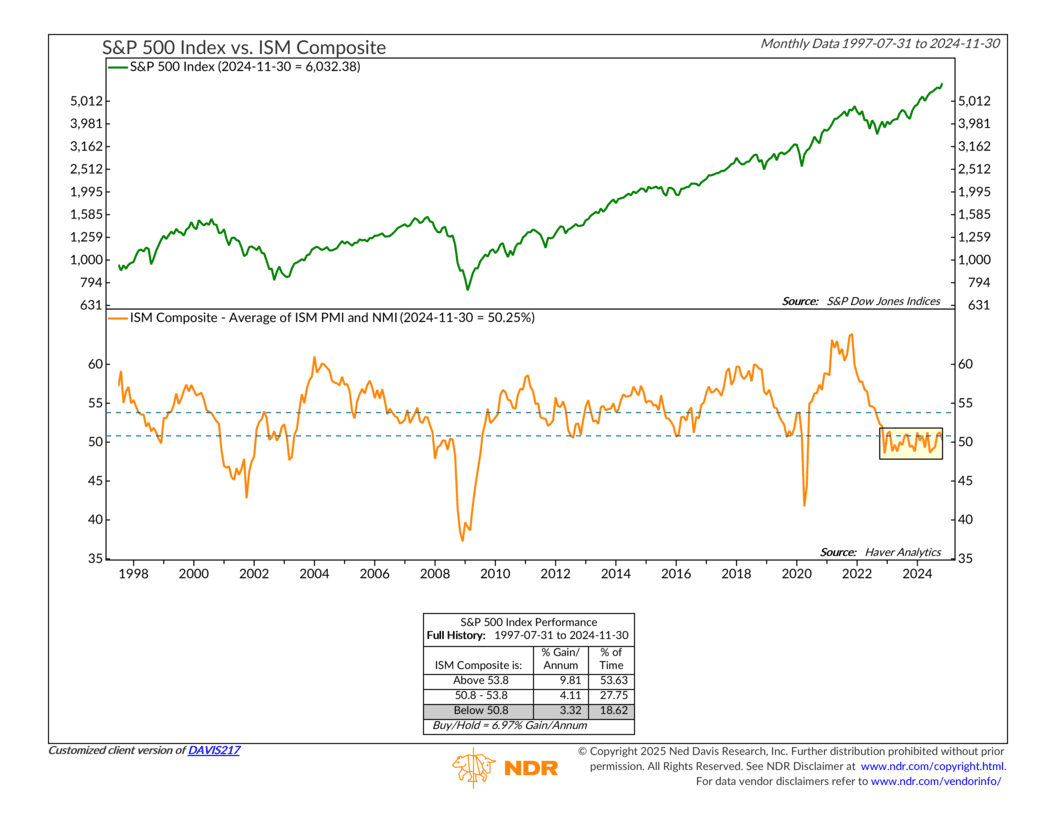
As you can see from the chart, it’s been stuck in a negative to low-neutral range for the past two years! From this perspective, the economy has been stuck in a bit of a rut for a while now and can’t seem to find its way through to higher ground.
Which brings us to our final indicator of economic activity: industrial production. Industrial production measures the actual output of the industrial sector of the economy. We find that when industrial production has been statistically high (above its 12-month standard deviation of returns) and then falls, it tends to create liquidity constraints for financial markets. This, in turn, results in poor returns for the S&P 500 Index.
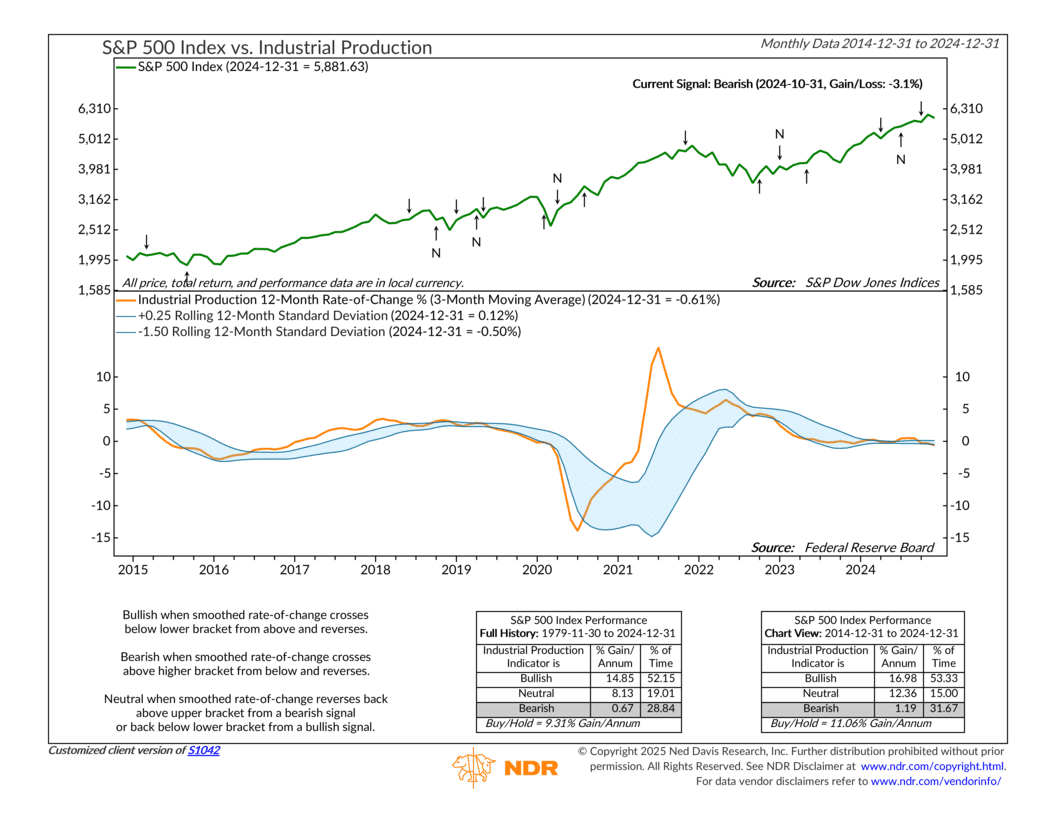
As you can see from the chart, changes in industrial production have resulted in a negative reading from this indicator, further supporting the idea that economic activity is starting to weigh on financial markets.
The bottom line? 2024 was a year of contrasts—steady GDP growth on the surface but underlying volatility in economic activity. The sharp movements in our indicators highlight how fragile the economic landscape has become, with the most recent plunge suggesting cracks in the foundation.
As we move into 2025, the path forward for financial markets will likely hinge on whether these economic indicators stabilize or continue to signal turbulence.
This is intended for informational purposes only and should not be used as the primary basis for an investment decision. Consult an advisor for your personal situation.
Indices mentioned are unmanaged, do not incur fees, and cannot be invested into directly.
Past performance does not guarantee future results.
The S&P 500 Index, or Standard & Poor’s 500 Index, is a market-capitalization-weighted index of 500 leading publicly traded companies in the U.S.
