OVERVIEW
U.S. stocks tumbled last week as bank troubles and a hawkish Fed threw cold water on risk assets. The S&P 500 dropped 4.55%, the Dow lost 4.44%, and the Nasdaq declined 4.71%.
Foreign stocks held up better, with developed country stocks decreasing about 0.9% and emerging market stocks dropping 3.31%.
The 10-year Treasury rate collapsed to 3.7%, down from 3.9% the week before. Intermediate-term Treasuries gained 1.6%, and long-term Treasuries surged 3.65%. Investment-grade corporate bonds rose 0.77%, while high-yield (junk) bonds dropped 0.9%.
The real estate sector got hammered, dropping about 7% for the week. Commodities were also down about 3.5% broadly. Oil declined 3.9%, but gold rose 1.4%. And the U.S. dollar remained relatively still, rising approximately 0.14% for the week.
KEY CONSIDERATIONS
Broken Banks, but Bye-Bye Bear? – It was a crazy week on Wall Street last week.
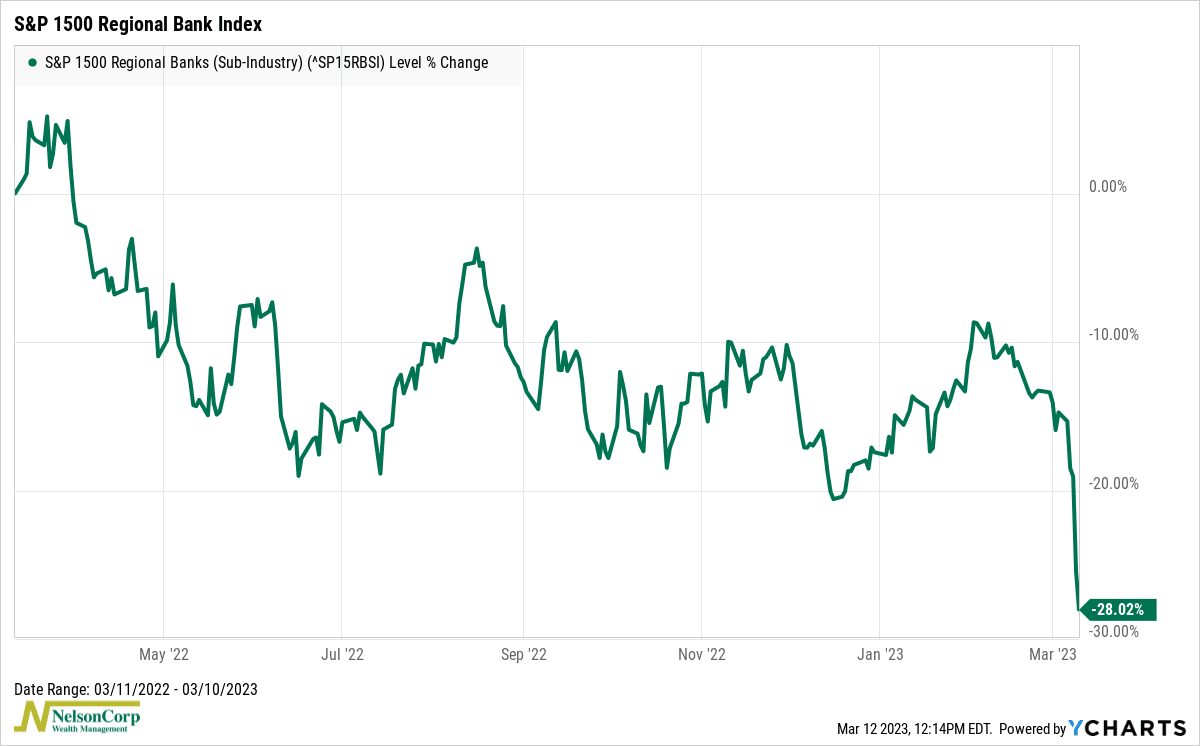
For one, a major U.S. bank headquartered in Silicon Valley collapsed due to a run on its deposits. The rest of the banking sector felt the heat as the reverberations swept through the market. Here’s how an index of regional bank stocks has performed recently.

Yikes. It appears that higher interest rates are really starting to affect the economy and financial markets in some interesting ways.
And that brings us to the other big news last week: Jerome Powell, the chairman of the Federal Reserve, testifying before Congress. In a nutshell, he said that interest rates might need to go even higher to combat stubbornly high inflation. Stocks were down pretty bad on the news.
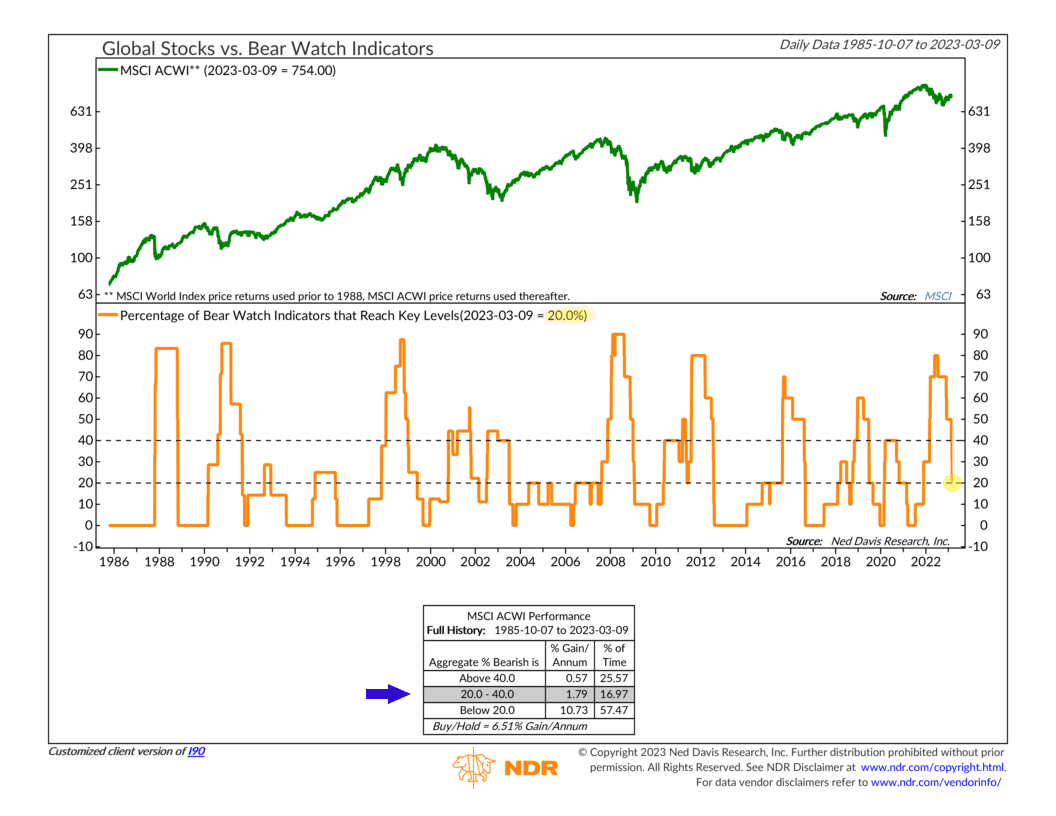
However, the good news amongst all this is that we are actually seeing signs that bear-market risks are finally starting to ease. For example, the chart below is called a “Bear Watch” indicator. It combines and measures indicators that tend to turn bearish before double-digit declines in the stock market.

Right now, only 20% of the indicators are at their key “bearish” levels. This is down from a high of 80% last year. In other words, the risk of a major, double-digit decline in global stock prices is declining.
But, at the same time, that doesn’t mean stocks can’t tread water or even decline from here. The percentage of bear watch indicators with a negative reading must drop below 20% to signal a genuinely positive environment for stocks. It’s not quite there yet.
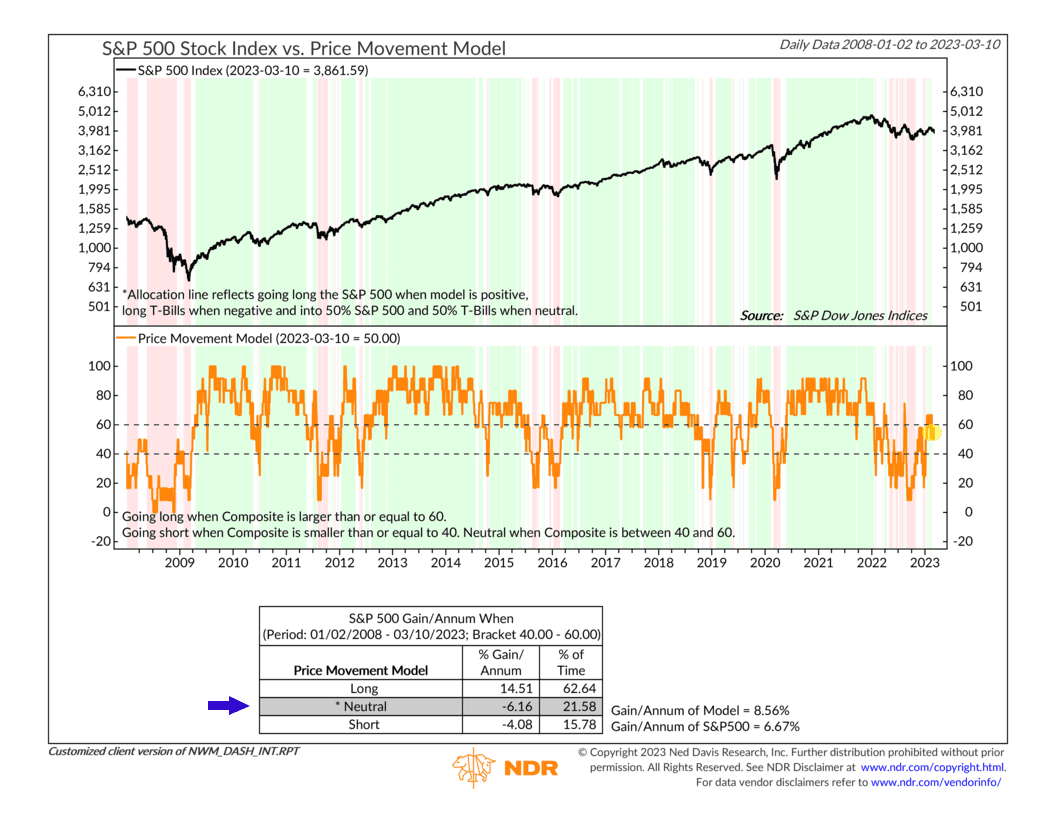
We had a pretty strong start to the year, but stocks have since given essentially all of that back. Indeed, our composite model that tracks the price movement of the stock market (shown below) got into a bullish zone earlier this year but is now hanging out in an upper-neutral zone.

As the performance box on the chart reveals, the S&P 500 Index really only performs well when this model is in its upper bullish zone—so more improvement is needed here.
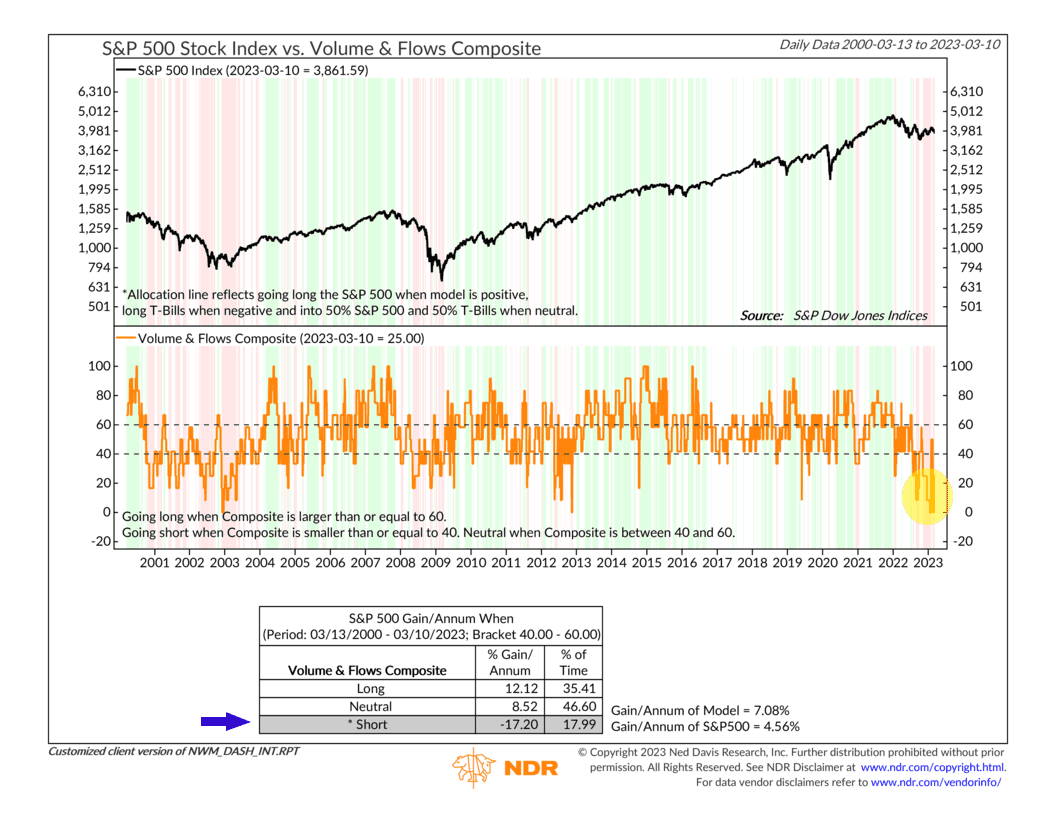
Where is improvement needed the most? Well, one area that could use some help is what we call volume and flows. Think of this as money flowing into or around the stock market. The more, the better.

But, as the composite model above shows, our volume and flow indicators have yet to see any real material improvement. The model hasn’t been in a positive zone for more than a few days since 2021. Basically, investors just aren’t that excited to jump headlong into equities right now; until they do, progress toward a new bull market will remain slow.
So, the bottom line? There are perhaps some reasons to believe that the scariest parts of the bear market are behind us, but that doesn’t necessarily mean the market can’t go down from here. The situation in the banking sector is still ongoing, but we’re hoping this was just a one-off problem in a niche sector of the economy. In fact, it may even get the Fed to reconsider hiking rates too much higher, which could be positive for stocks.
Overall, though, the weight of the evidence suggests that the current environment is still primarily neutral for risk assets at this time, but investors should stay diligent and not be surprised by higher-than-normal uncertainty in the coming months.
This is intended for informational purposes only and should not be used as the primary basis for an investment decision. Consult an advisor for your personal situation.
Indices mentioned are unmanaged, do not incur fees, and cannot be invested into directly.
Past performance does not guarantee future results.
