OVERVIEW
It was a very positive week for U.S. stocks. The S&P 500 gained 4.66%, the Dow rose 4.61%, and the Nasdaq surged 5.74%. Small caps outperformed them all, skyrocketing nearly 9% for the week.
Foreign stocks, on the other hand, saw more moderate gains. Emerging markets rose 1.19%, and developed countries rose just 0.02%.
The U.S. dollar strengthened about 0.68% for the week.
Bonds had a decent week as the benchmark 10-year Treasury rate stayed relatively steady at around 4.3%. In aggregate, the bond market increased about 0.8%.
Real estate had a good week, up nearly 3%. And commodities rose about 0.07%. While oil increased 1.54%, gold fell around 1.6%. Corn surged over 5%.
KEY CONSIDERATIONS
Bulls on Parade – Things got really bullish on Wall Street last week. As we pointed out in this week’s Chart of the Week, the markets tend to like it when uncertainty gets resolved. And with the election now over, it appears the market has been given the green light to launch higher.
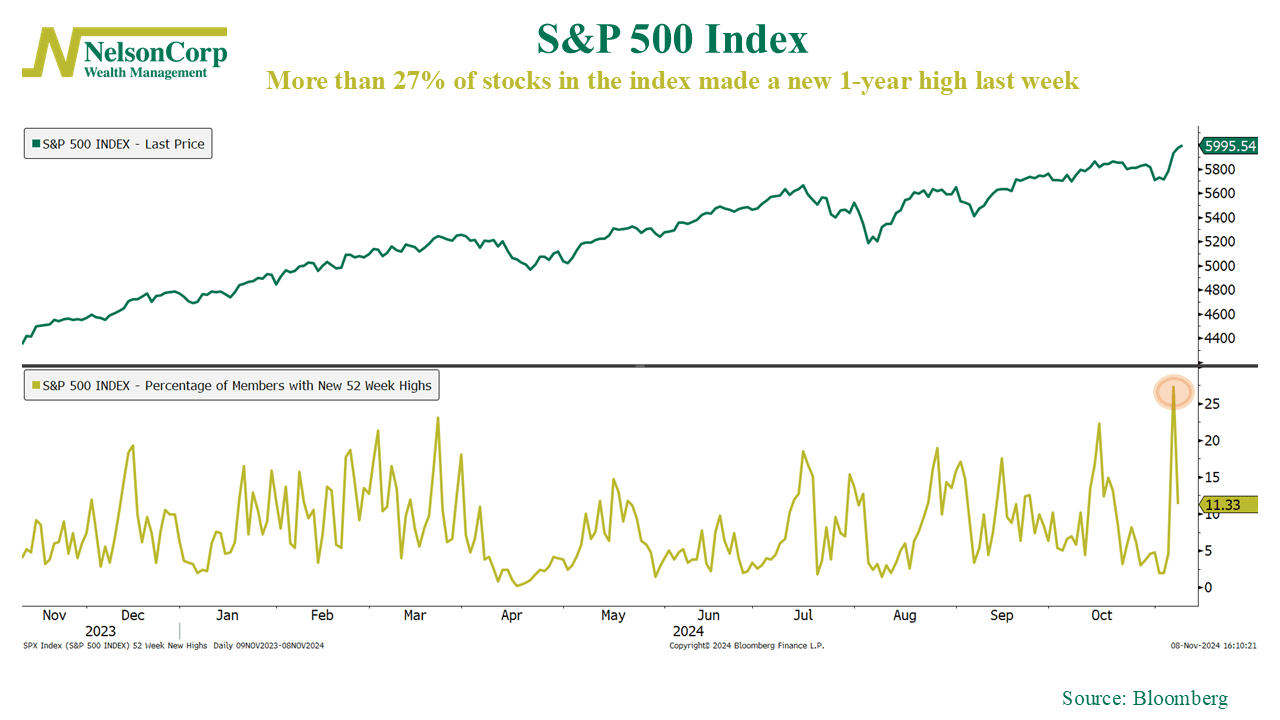
As you can see on the chart below, the percentage of stocks in the S&P 500 index trading at a new 1-year high skyrocketed to over 27% in one day last week. That’s the highest we’ve seen all year.

That’s what we call a breadth thrust. It means more stocks are participating in the rally—a good thing.
But of course, it’s not all that surprising to see the market gain a second wind here. As we pointed out just a few weeks ago, based on historical seasonality, we expect the market to do well heading into the end of the year.
With that said, however, we don’t want to get too far out over our skis here. The market can’t just go up forever. Eventually, gravity sets in. In the technical world, we call this getting “overbought.”
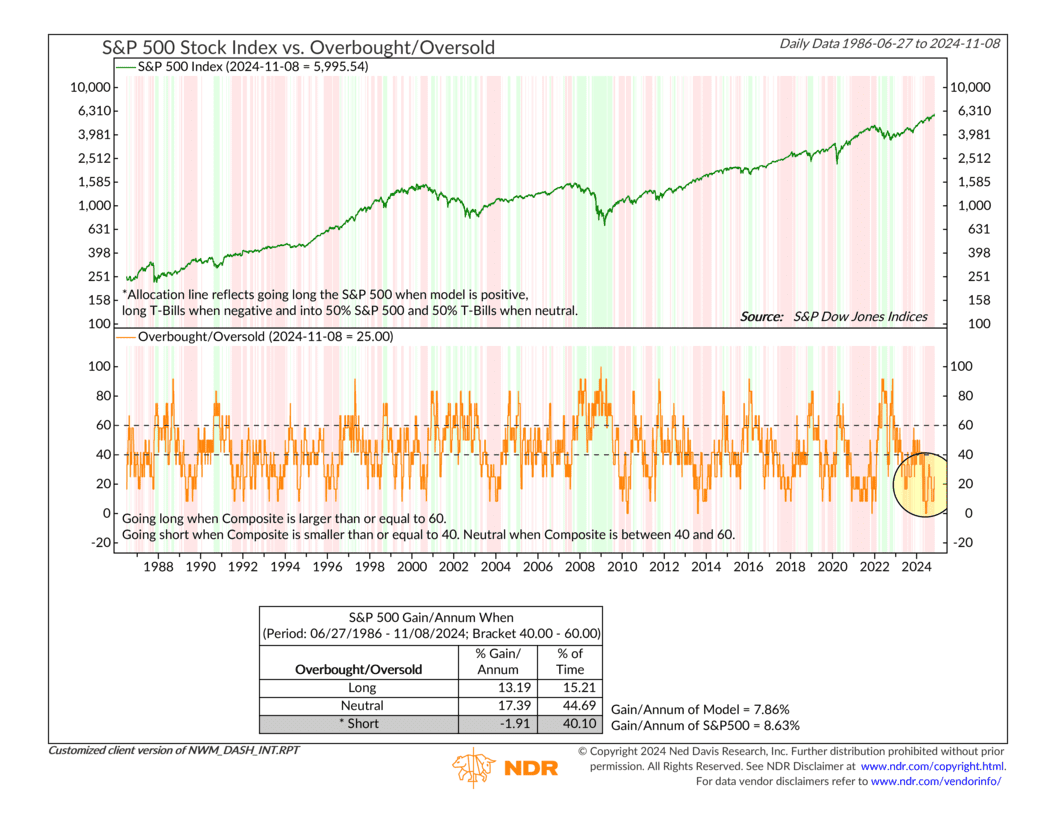
We actually have a sub-model that tracks the stock market on an overbought/oversold basis. And as you can see below, it’s been trading in its lowest quartile of returns for some months now, a sign that the market is indeed technically overbought.

So, we’ll want to keep an eye on this, as well as sentiment, as those could become the catalysts for the market’s next downturn.
But for now, the weight of evidence is certainly being overwhelmed by strong price action and breadth expansion, which has kept our models tilted to the bullish side of things.
This is intended for informational purposes only and should not be used as the primary basis for an investment decision. Consult an advisor for your personal situation.
Indices mentioned are unmanaged, do not incur fees, and cannot be invested into directly.
Past performance does not guarantee future results.
The S&P 500 Index, or Standard & Poor’s 500 Index, is a market-capitalization-weighted index of 500 leading publicly traded companies in the U.S.
