OVERVIEW
Markets retreated last week, giving back the prior week’s gains. The S&P 500 fell 1.53%, while the Dow Jones Industrial Average declined 0.96%. The NASDAQ led the move lower, dropping 2.59%, and is now down more than 10% year-to-date.
Broader markets were also in the red. The Russell 3000 slid 1.57%, with growth stocks again underperforming—Russell 3000 Growth sank 2.52%, compared to a smaller 0.48% loss for value. Mid- and small-cap indexes followed suit, with the S&P 400 and S&P 600 down 1.04% and 1.23%, respectively.
International stocks mirrored U.S. weakness. Developed markets (EAFE) fell 1.35%, and emerging markets dropped 0.94%. The U.S. dollar was roughly flat, edging up 0.04%.
Bond performance was mixed. While short- and intermediate-term Treasuries were slightly positive, longer durations slipped. Long-term Treasuries declined 0.60%, and investment-grade bonds fell 0.21%. High-yield bonds dipped 0.44%.
Commodities showed strength. Gold gained 2.16%, extending its rally to nearly 18% year-to-date. Oil rose 1.33%, and MLPs added 1.14%. On the flip side, corn dropped 2.37%.
KEY CONSIDERATIONS
Correction Hangover – The stock market took a major step back last week. And while it’s still above the recent lows from that 10% correction, history says we might still be dealing with a good old-fashioned correction hangover.
Here’s what I mean.
The chart below tracks how the S&P 500 has historically performed after a 10% drop. It splits the data between periods that led into a recession and those that didn’t. Unsurprisingly, returns are much worse when a correction turns into a recession.
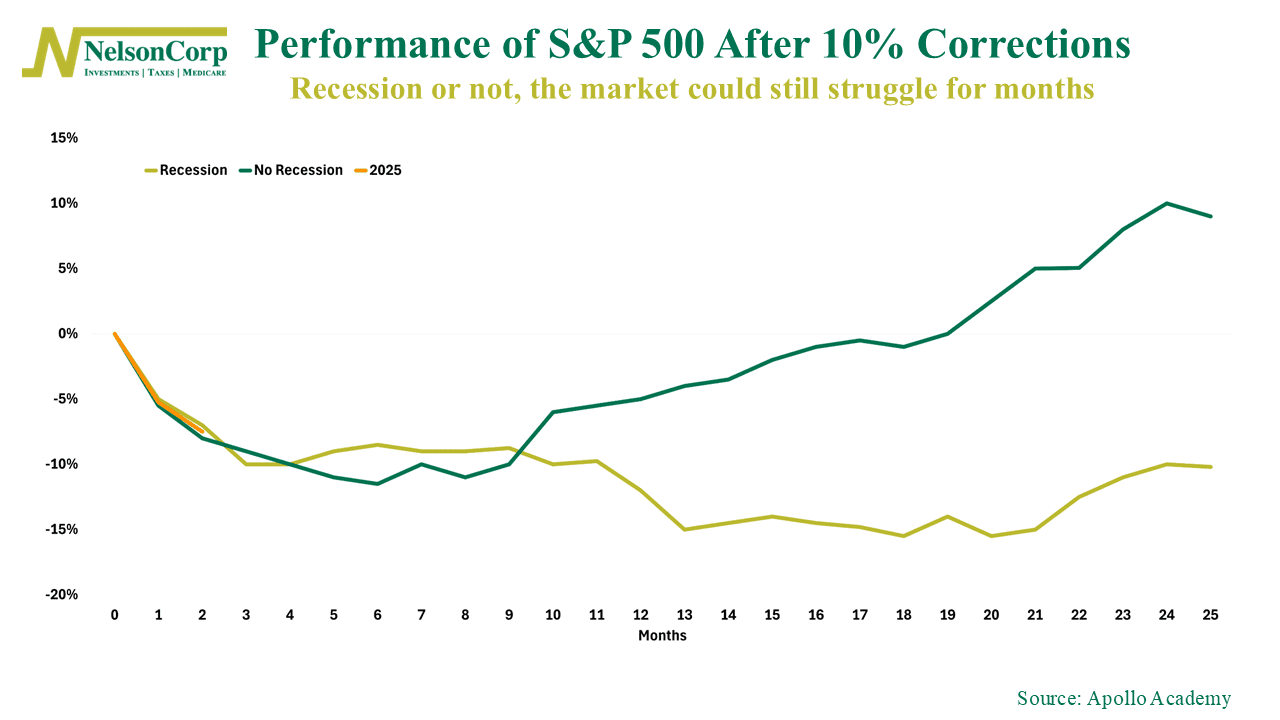
That part’s expected. But what really stands out is what happens even without a recession.
In these non-recessionary corrections, the market still tends to struggle for months. On average, it tends to tread water through month 10—and doesn’t fully recover until month 19. That’s a long time to be stuck in the mud, even in the best-case scenario.
That’s pretty eye opening. Even if the worst of the decline is behind us, the next few months could still feel sluggish. Gains, if they come, may be slow and choppy.
So really, the market is at a bit of a crossroads right now. If the economy holds up, history says we eventually climb out of this. But if something breaks, we could be in for a much rougher ride.
As for our indicators, we still have some work to do. Not helping is the fact that some very important price action indicators—like our Trend Deviation indicator, shown below—flipped to bearish last week.
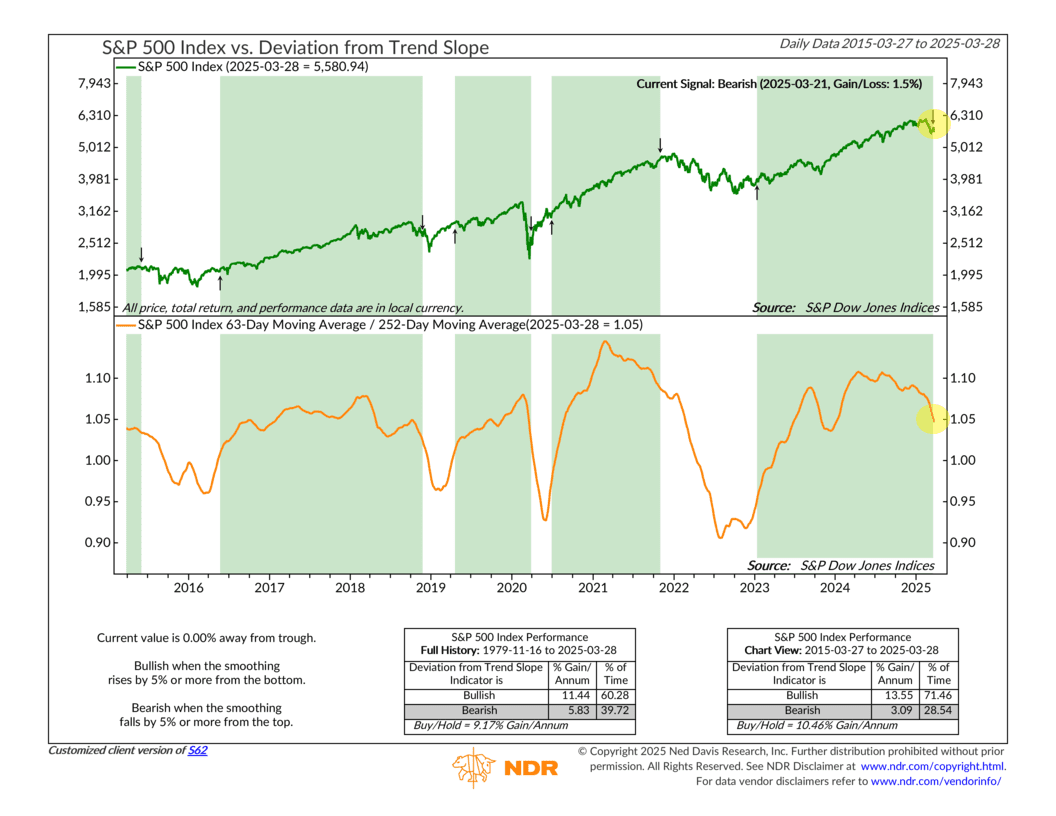
This indicator measures how far the market has drifted above or below its long-term trend. When it turns negative—like it just did—it’s usually a sign that momentum is fading. Historically, forward returns in these bearish zones have been much weaker, averaging just 3.81% per year compared to over 13% when the indicator is bullish.
The bottom line? While the worst of the decline could be behind us, the path ahead might be slow and choppy. With key indicators now signaling caution, investors should be prepared for potential headwinds in the coming months.
This is intended for informational purposes only and should not be used as the primary basis for an investment decision. Consult an advisor for your personal situation.
Indices mentioned are unmanaged, do not incur fees, and cannot be invested into directly.
Past performance does not guarantee future results.
The S&P 500 Index, or Standard & Poor’s 500 Index, is a market-capitalization-weighted index of 500 leading publicly traded companies in the U.S.