OVERVIEW
Markets took another hit this week, with major indexes seeing widespread losses. The S&P 500 dropped 2.27%, while the Dow Jones Industrial Average fell 3.07%. The tech-heavy Nasdaq wasn’t spared either, declining 2.43%.
Small- and mid-cap stocks struggled as well. The S&P 600 (small-cap) slid 2.68%, while the S&P 400 (mid-cap) fell 2.01%. Broader market performance mirrored the decline, with the Russell 3000 down 2.18% and growth stocks underperforming, as the Russell 3000 Growth index lost 2.47%.
International markets held up better in comparison. Developed markets (EAFE) dipped just 1.17%, while emerging markets fell 0.79%. Meanwhile, the U.S. dollar was flat on the week.
Bond markets provided some stability. Long-term Treasuries eked out a 0.03% gain, while short-term Treasuries rose 0.08%. Investment-grade bonds slipped 0.27% but still outperformed equities.
Commodities had a mixed week. Broad commodities rose 0.11%, oil gained 0.26%, and gold outshined with a 3.73% rally. Corn, however, dropped 2.29%.
KEY CONSIDERATIONS
Correction in Context – It was another raucous week for the stock market. The S&P 500 stock index officially entered correction territory, dropping more than 10% from its all-time high. It’s been a minute since that last happened. But more importantly, the S&P 500 dipped further below its 200-day moving average—a key technical level where, as we noted last week, bad things tend to happen.
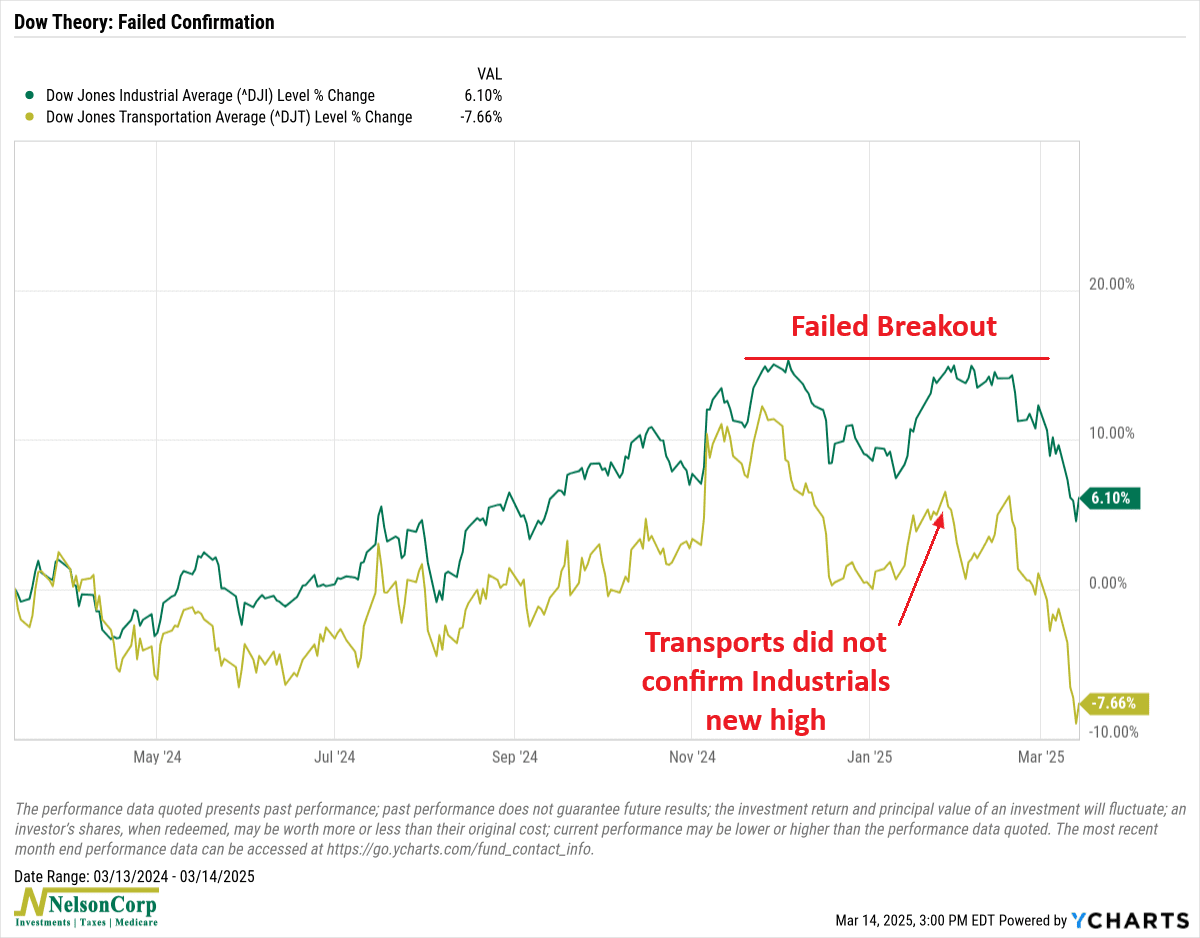
Another way to think about this—from a technical perspective—is the famous Dow Theory. In a nutshell, Dow Theory says a market trend is strong when both the Dow Jones Industrial Average (the stock market) and the Dow Jones Transportation Average (shipping & logistics) move in the same direction. If one rises while the other lags or falls, it could mean the trend is weakening or about to reverse. Think of it like a train—if the engine (industrials) moves forward but the cars (transportation) don’t follow, the market might be running out of steam.
As the following chart shows, that’s exactly what happened. About a month ago, the Industrials attempted to break to new highs but failed, as the Transports did not confirm the move. The result? A broad market sell-off pulling down all major U.S. indices.
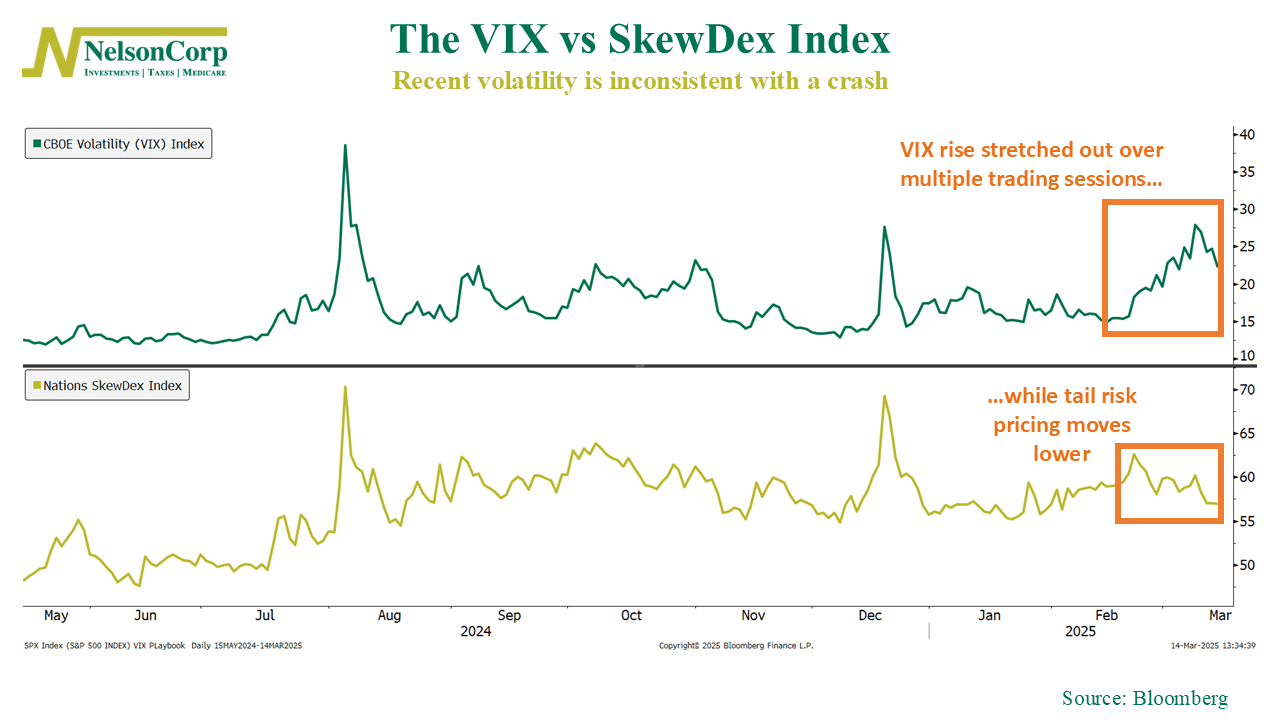
The thing about this selloff, though, is that it’s not exactly what we’d call a “crash.” Even though the actual correction in stock prices has happened fairly quickly, if we look at the volatility indexes, there hasn’t been a dramatic spike in fear like in some past selloffs.
As the following chart shows, the VIX Index (green line)—Wall Street’s “fear gauge”—has risen, but at a fairly measured pace, while the SkewDex Index (gold line), has actually been declining. Basically, this means we are experiencing a broad market decline where investors are buying protection but are not anticipating an extreme crash.
So, what’s driving this selloff? Mostly multiples re-pricing. Investors are simply less willing to pay as much for a dollar of earnings today as they were a couple of months ago, largely due to increased uncertainty surrounding tariffs.
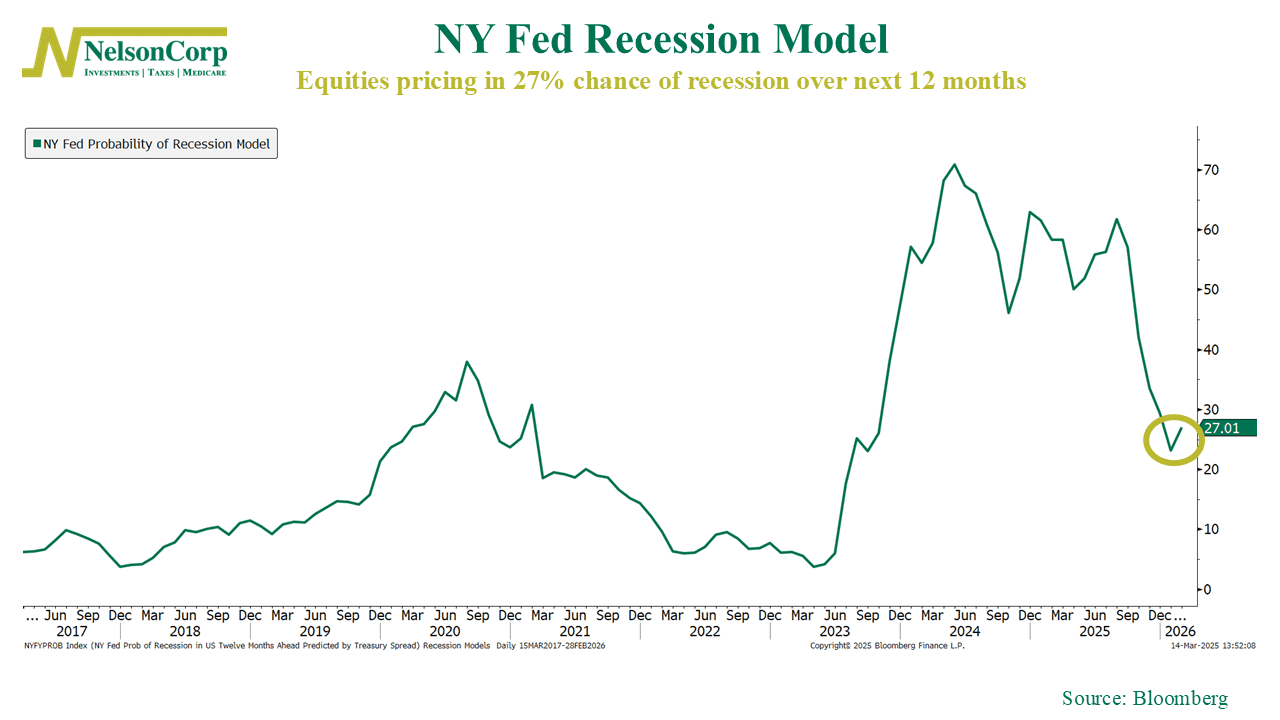
But the biggest factor weighing on valuations is the growing risk of the dreaded R-word—recession.
As the following chart shows, the NY Fed model currently assigns a 27% probability of a U.S. recession—a little over 1 in 4. While this number has come down in recent weeks, it still reflects a meaningful level of concern from an economic standpoint.
In contrast, credit markets are signaling a much lower recession probability. The Fed Excess Bond Premium Recession Model, which measures stress in credit spreads, has remained relatively muted. This suggests that bond investors—who tend to be more forward-looking—aren’t pricing in an imminent downturn.
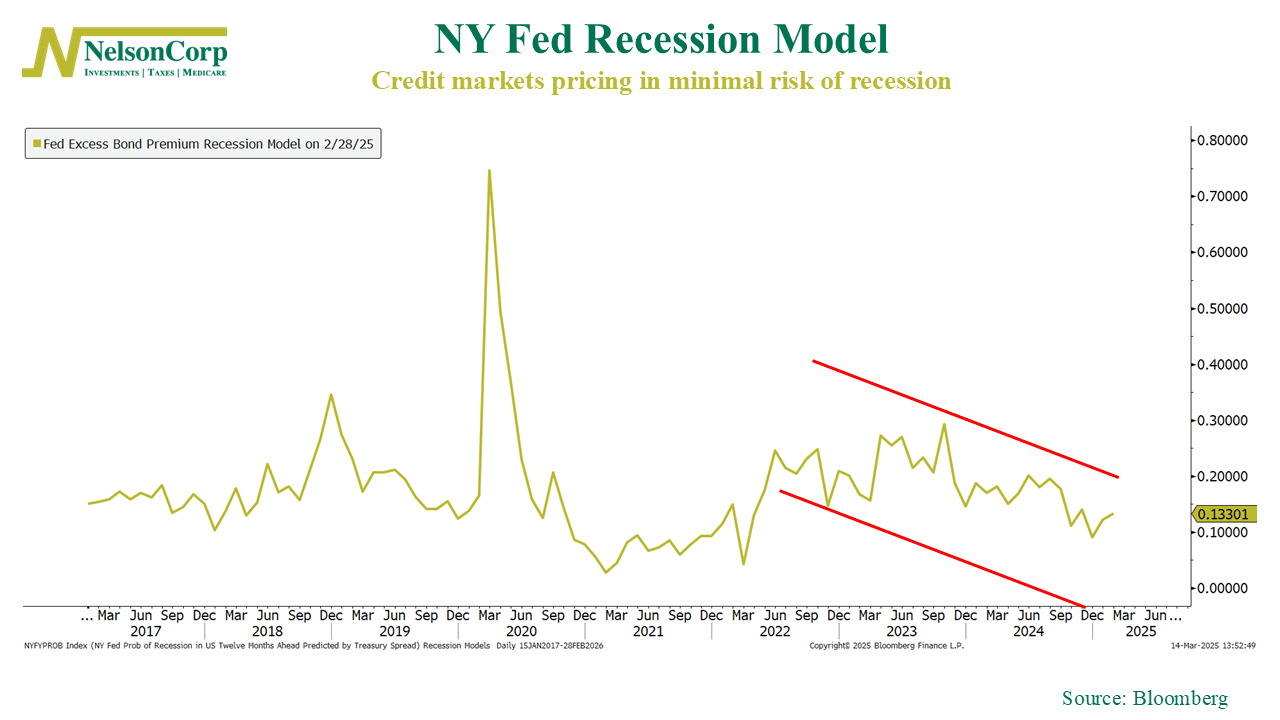
So yes, the stock market is pricing in recession risks, but credit markets are signaling more resilience. While the correction may feel unsettling, conflicting signals leave room for a potential upside surprise.
The key takeaway? The selloff has been sharp, but without a surge in fear or confirmation from credit markets, it looks more like a repricing event than the start of something much worse.
However, as with anything on Wall Street, conditions can shift fast. We’ll keep a close eye on our indicators for signs that it’s time to start adding risk again—or if patience remains the best approach.
This is intended for informational purposes only and should not be used as the primary basis for an investment decision. Consult an advisor for your personal situation.
Indices mentioned are unmanaged, do not incur fees, and cannot be invested into directly.
Past performance does not guarantee future results.
The S&P 500 Index, or Standard & Poor’s 500 Index, is a market-capitalization-weighted index of 500 leading publicly traded companies in the U.S.