OVERVIEW
It was a bumpy week for U.S. stocks. The S&P 500 dropped 2.06%, the Dow dipped 2.10%, and the Nasdaq dived 3.35%. Small caps brought up the rear, down more than 5.5% for the week.
Foreign stocks did better on a relative basis but were still in the red for the week. Developed countries fell 1.98%, and emerging markets dropped 1.03%.
Bonds, on the other hand, did really well. The benchmark 10-year Treasury rate plummeted to 3.8%, down from 4.2% just a week before. The rate drop resulted in significant gains for long-term Treasuries, up more than 6% for the week. Overall, the bond market rose around 2%.
Real estate did well, too, rising about 1.9%. However, commodities dipped 1.3%. Oil fell 3.57%, and corn dipped 2%. Gold, on the other hand, rose about 1.7%. And finally, the U.S. dollar weakened about 0.87%.
KEY CONSIDERATIONS
Dog Days – Yep, we’re deep into the dog days of summer now.
Traditionally, this has been one of the hottest parts of the year, spanning from around July 3rd to August 11th. This term dates back to ancient Greece and Rome, referring to the Dog Star, Sirius, which rises and sets with the sun during this period. People believed this alignment caused the season’s extreme heat.
Interestingly, it seems the Dog Star’s influence has also extended to the stock market, bringing a heat wave of rising volatility.
Just take a peek at the VIX Index (shown below), our go-to measure of market volatility.
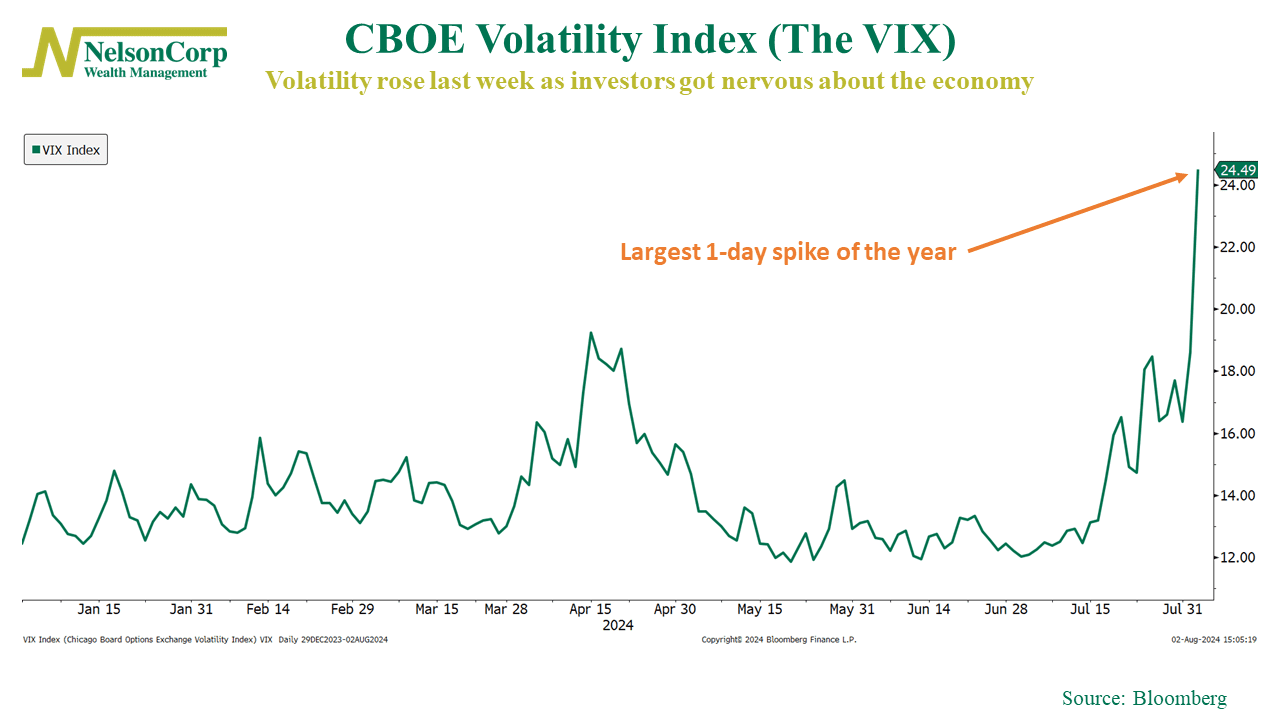
Yikes. That is quite the spike.
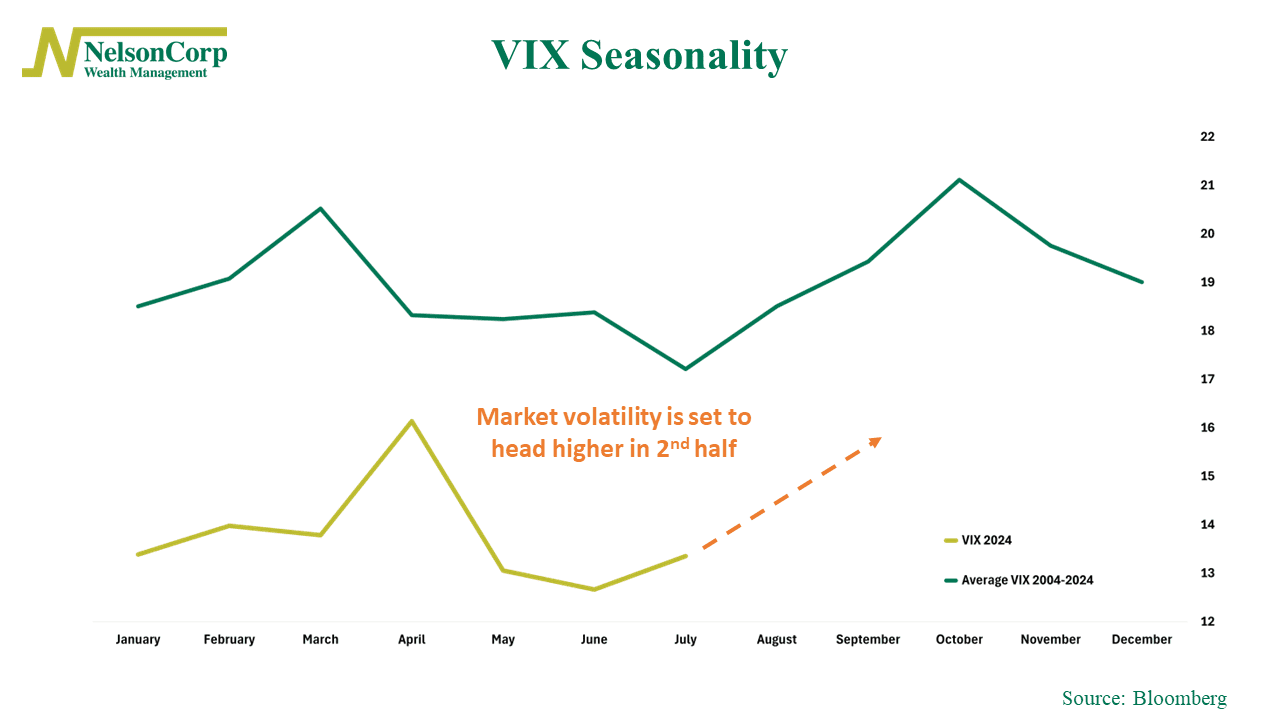
To be sure, volatility has been unusually muted so far this year. Based on the seasonality data shown below, we would expect volatility to rise in the second half of the year.
But still, seasonality aside, something really spooked investors last week.
Maybe it was this?
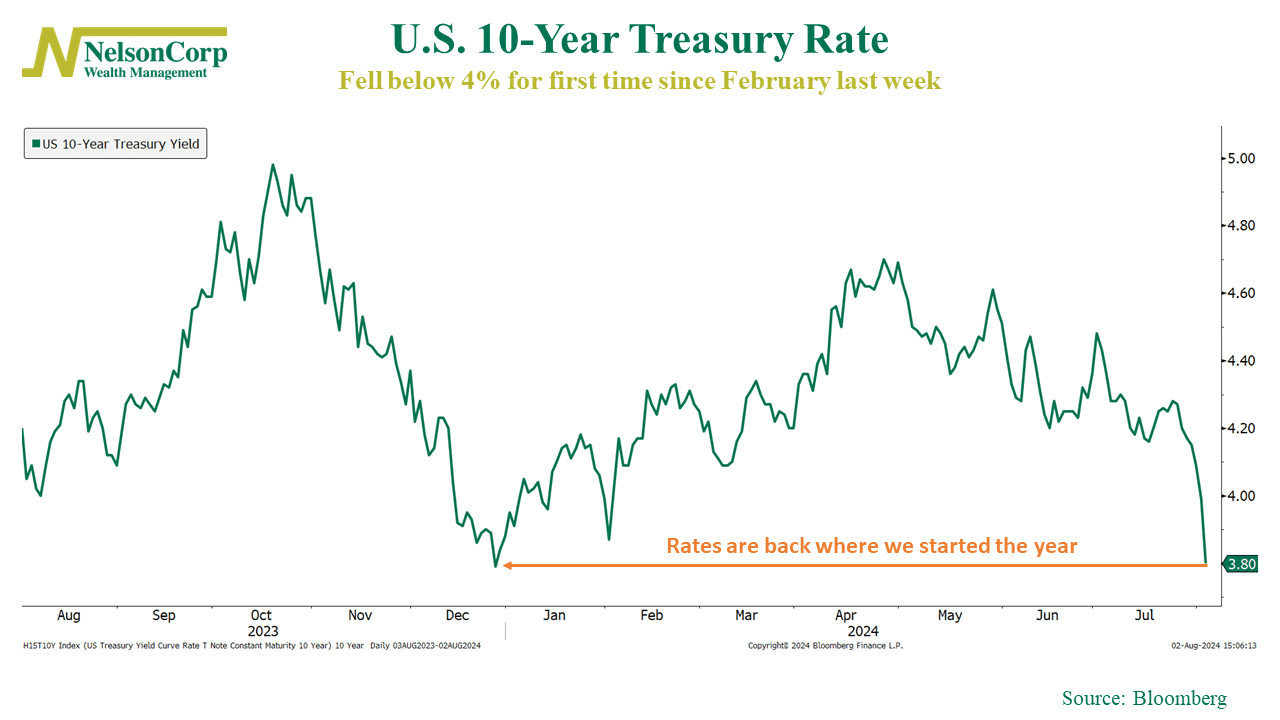
That chart shows the benchmark 10-year Treasury rate, which dipped below 4% for the first time since February last week.
We can blame the weaker-than-expected jobs report for that, which came out on Friday and revealed that the jobless rate rose to its highest level in nearly three years last month.
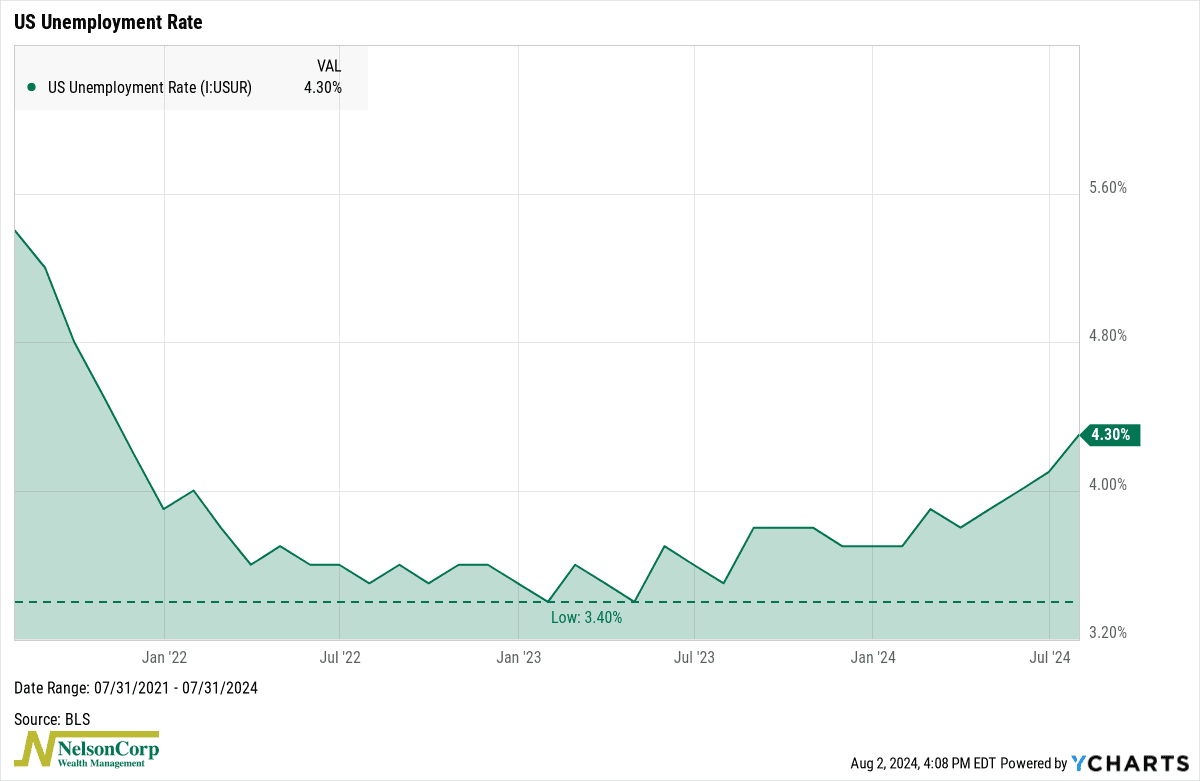
In other words, investors are starting to worry about a weak economy. In response, they are buying up bonds and driving rates lower. In its meeting last week, the Fed relayed the possibility that it would be doing something similar in as soon as about a month.
As the saying goes, the bond market is the tail that wags the stock market’s dog. So, should stock investors be worried?
Well, our risk models have been hovering around neutral levels for some time now, suggesting it might be wise to ease up on stocks and consider longer-duration government bonds. This has proven to be sound advice so far.
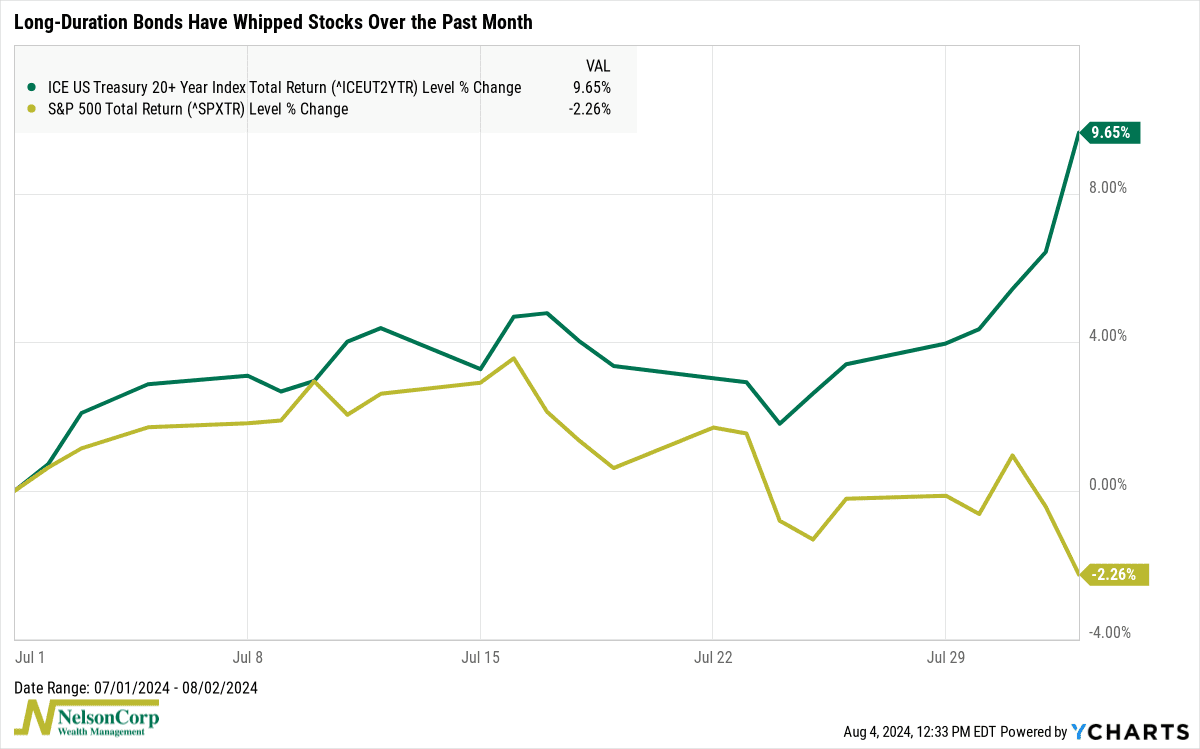
But now that stocks have eased off the gas pedal a bit, maybe now is a good time to buy the dip?
As this final chart shows, dip buying in these conditions has actually been fairly profitable in the past.
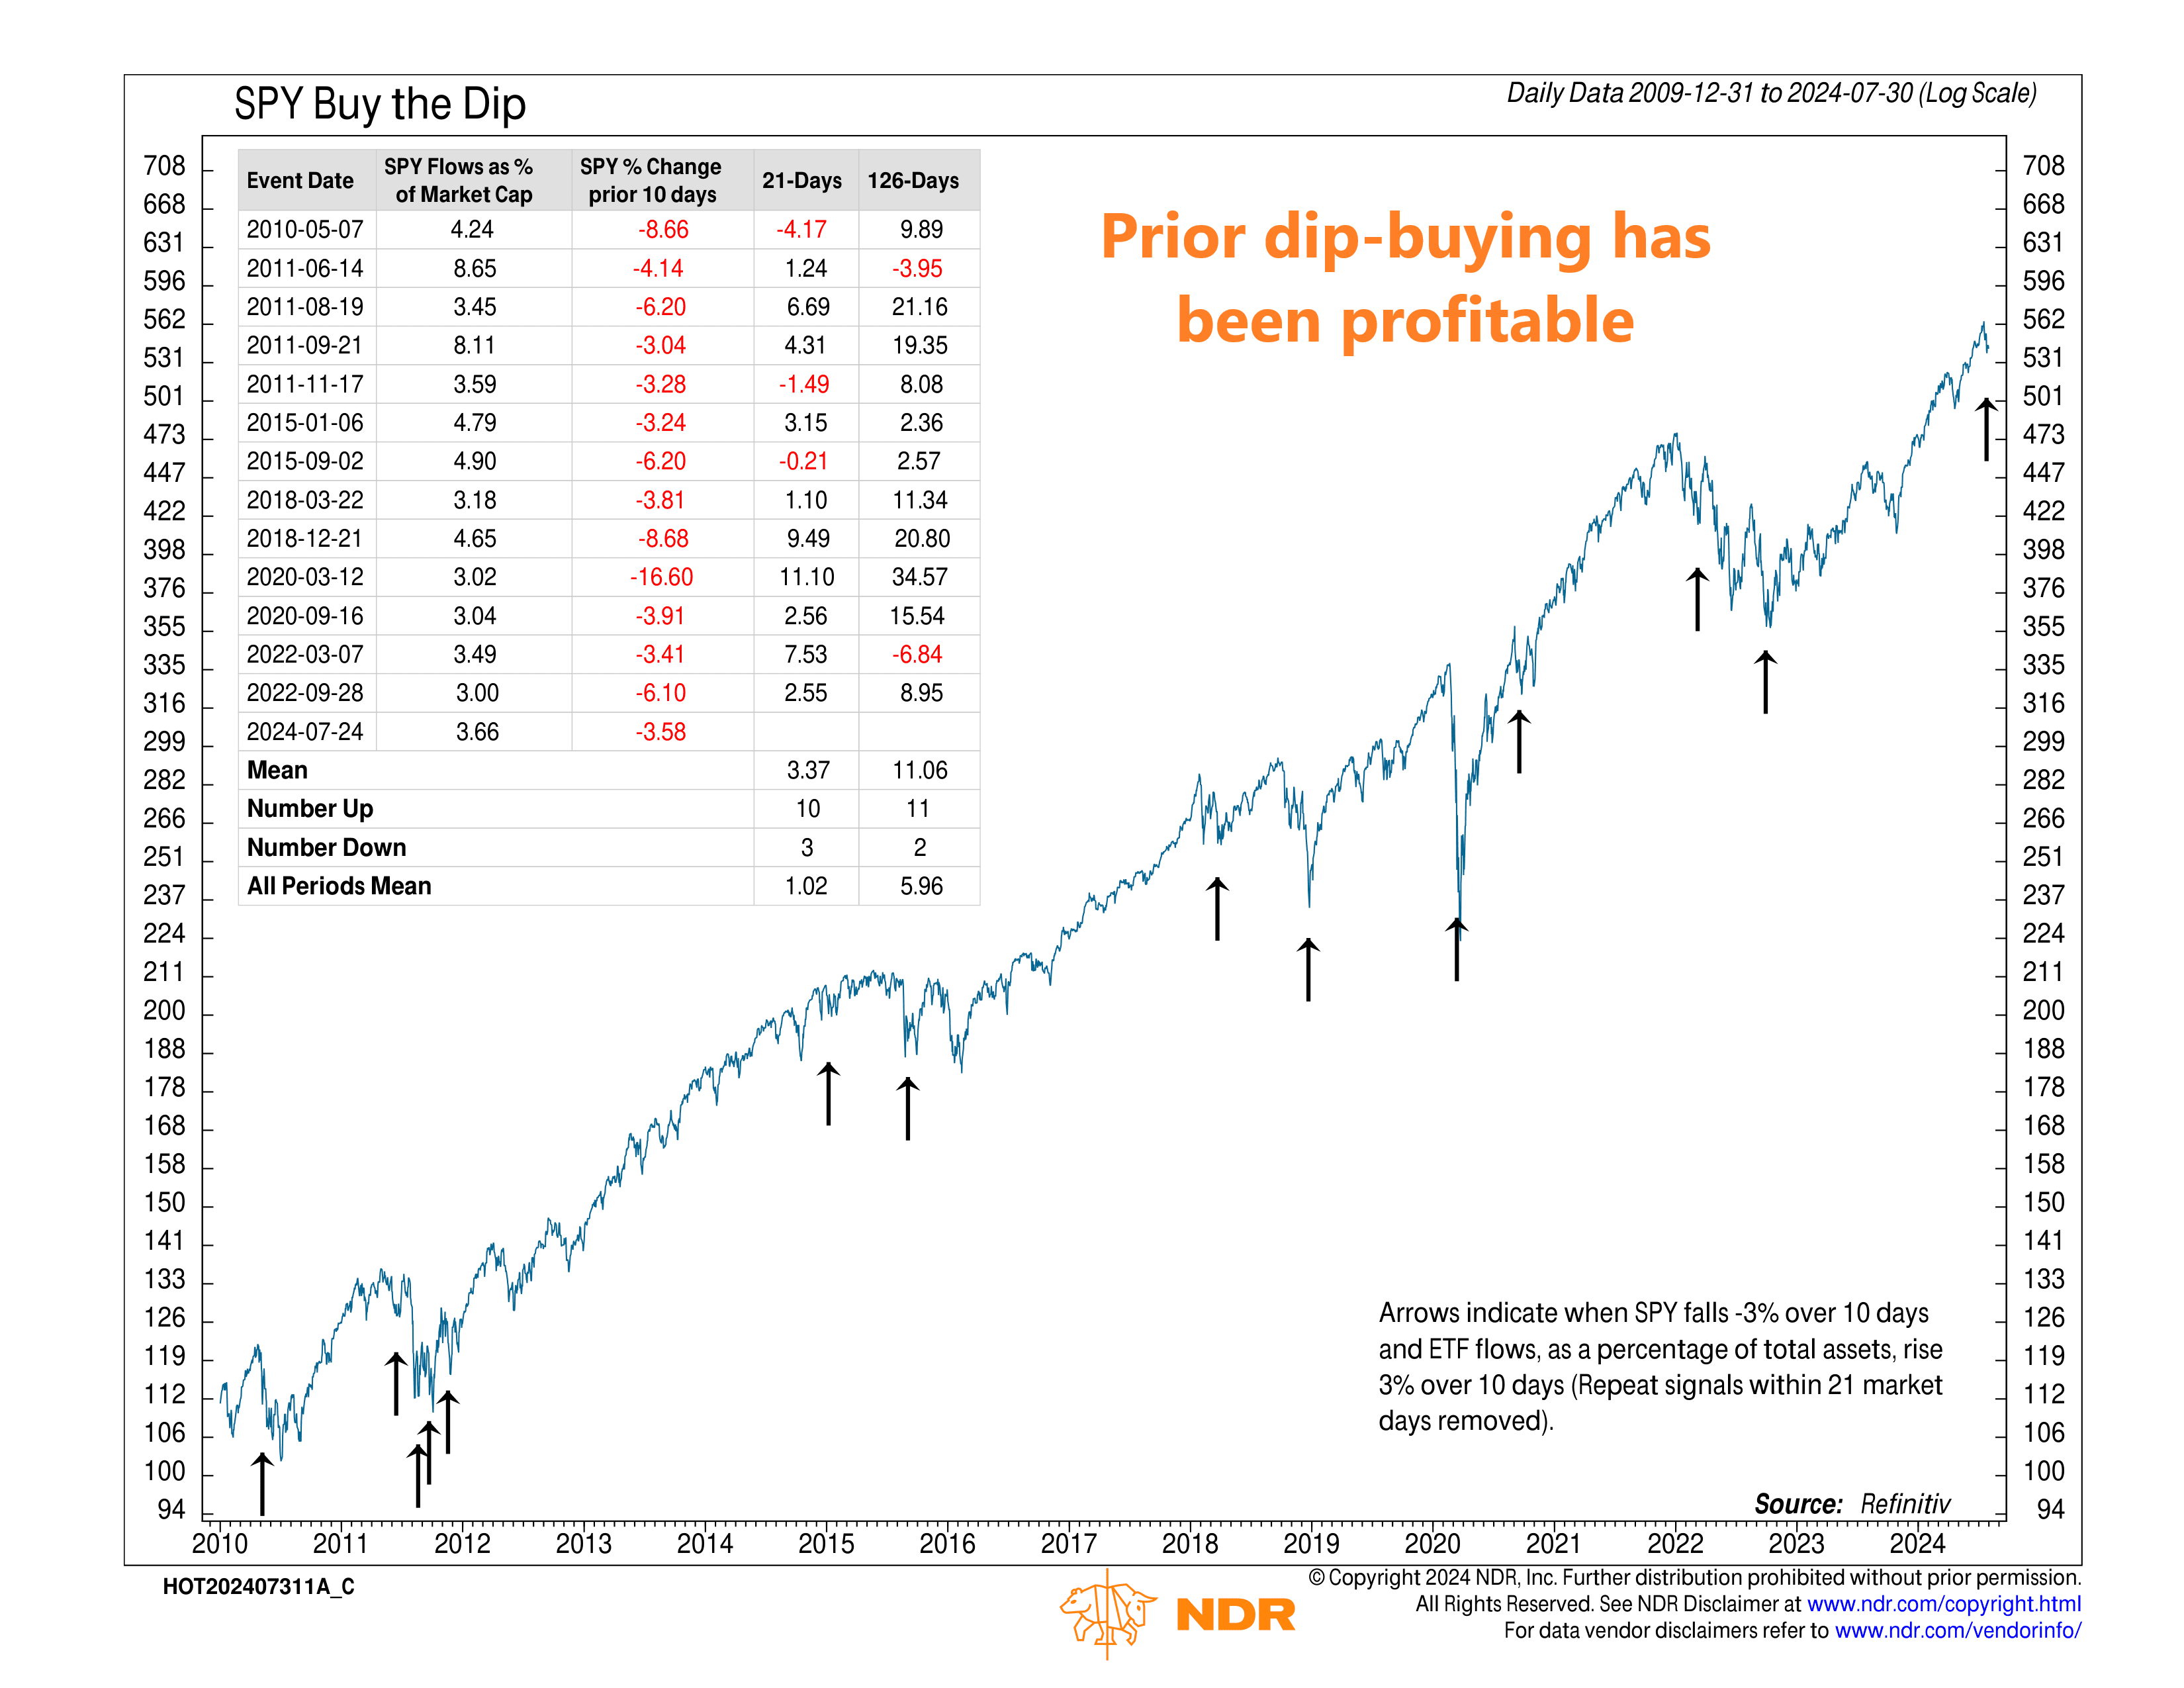
As you can see, there have been 13 other instances since 2010 in which the S&P 500 has dropped 3% or more over ten days, and ETF flows, as a percentage of assets, rose over 3% over ten days. The average stock market gain a month later was 3.37%, and six months later, it was 11.06%.
To be fair, there’s no guarantee it will work out similarly this time around. But our models do suggest that any dip in the stock market is more than likely just a short-term correction within a longer-term bull market at this point.
This is intended for informational purposes only and should not be used as the primary basis for an investment decision. Consult an advisor for your personal situation.
Indices mentioned are unmanaged, do not incur fees, and cannot be invested into directly.
Past performance does not guarantee future results.
The S&P 500 Index, or Standard & Poor’s 500 Index, is a market-capitalization-weighted index of 500 leading publicly traded companies in the U.S.
