OVERVIEW
This past week presented a mixed picture for U.S. markets. The S&P 500 edged down 0.24%, while the Dow Jones Industrial Average managed a 0.54% gain. The Nasdaq slipped 0.53%, continuing its recent struggles. Meanwhile, small-cap stocks had a rough week, with the S&P 600 declining 1.17% and mid-caps (S&P 400) dropping 1.00%.
International markets fared better, with developed markets (EAFE) rising 0.23%, while emerging markets posted a strong 1.38% gain. The U.S. dollar weakened slightly, slipping 0.27% against major currencies.
Bond markets remained relatively stable, with long-term Treasuries climbing 1.97%, intermediate-term Treasuries up 0.39%, and short-term Treasuries inching up 0.07%. Investment-grade bonds gained 0.37%, while high-yield bonds were flat for the week (0.00%).
Commodities saw mixed performance. Broad commodities rose 1.89%, while oil dropped sharply by 2.77%. Gold continued to shine as a safe-haven asset, gaining 1.86%, and corn climbed 1.68%. Meanwhile, real estate posted a solid 1.19% increase.
Volatility remained in check, with the VIX up 0.67%, but still showing a 4.67% decline year-to-date.
KEY CONSIDERATIONS
Drifting, But Not Drowning – For the past two months, the S&P 500 has been acting like a boat tethered to a dock—drifting with the tide but never breaking free. Each time it moves away from the 6,050 level, it gets pulled right back, as if on an invisible leash.
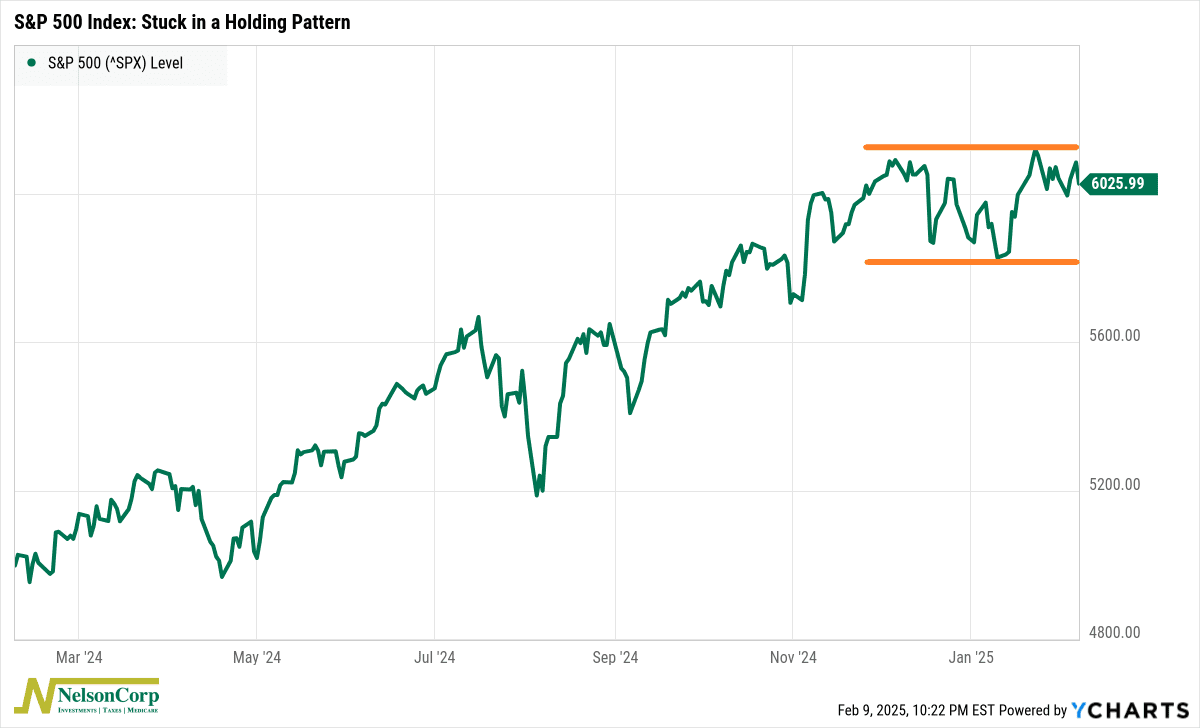
This kind of price action isn’t unusual after a strong rally. Market technicians call it a “consolidation,” a natural pause where stocks catch their breath before deciding on the next move.
But don’t mistake the market’s sideways drift for a lack of action—underneath the surface, earnings season has been delivering solid results. So far, 77% of S&P 500 companies have beaten profit expectations, while 63% have topped revenue estimates. That’s down from recent highs of over 80% but still a clear improvement from the dip we saw in Q3.
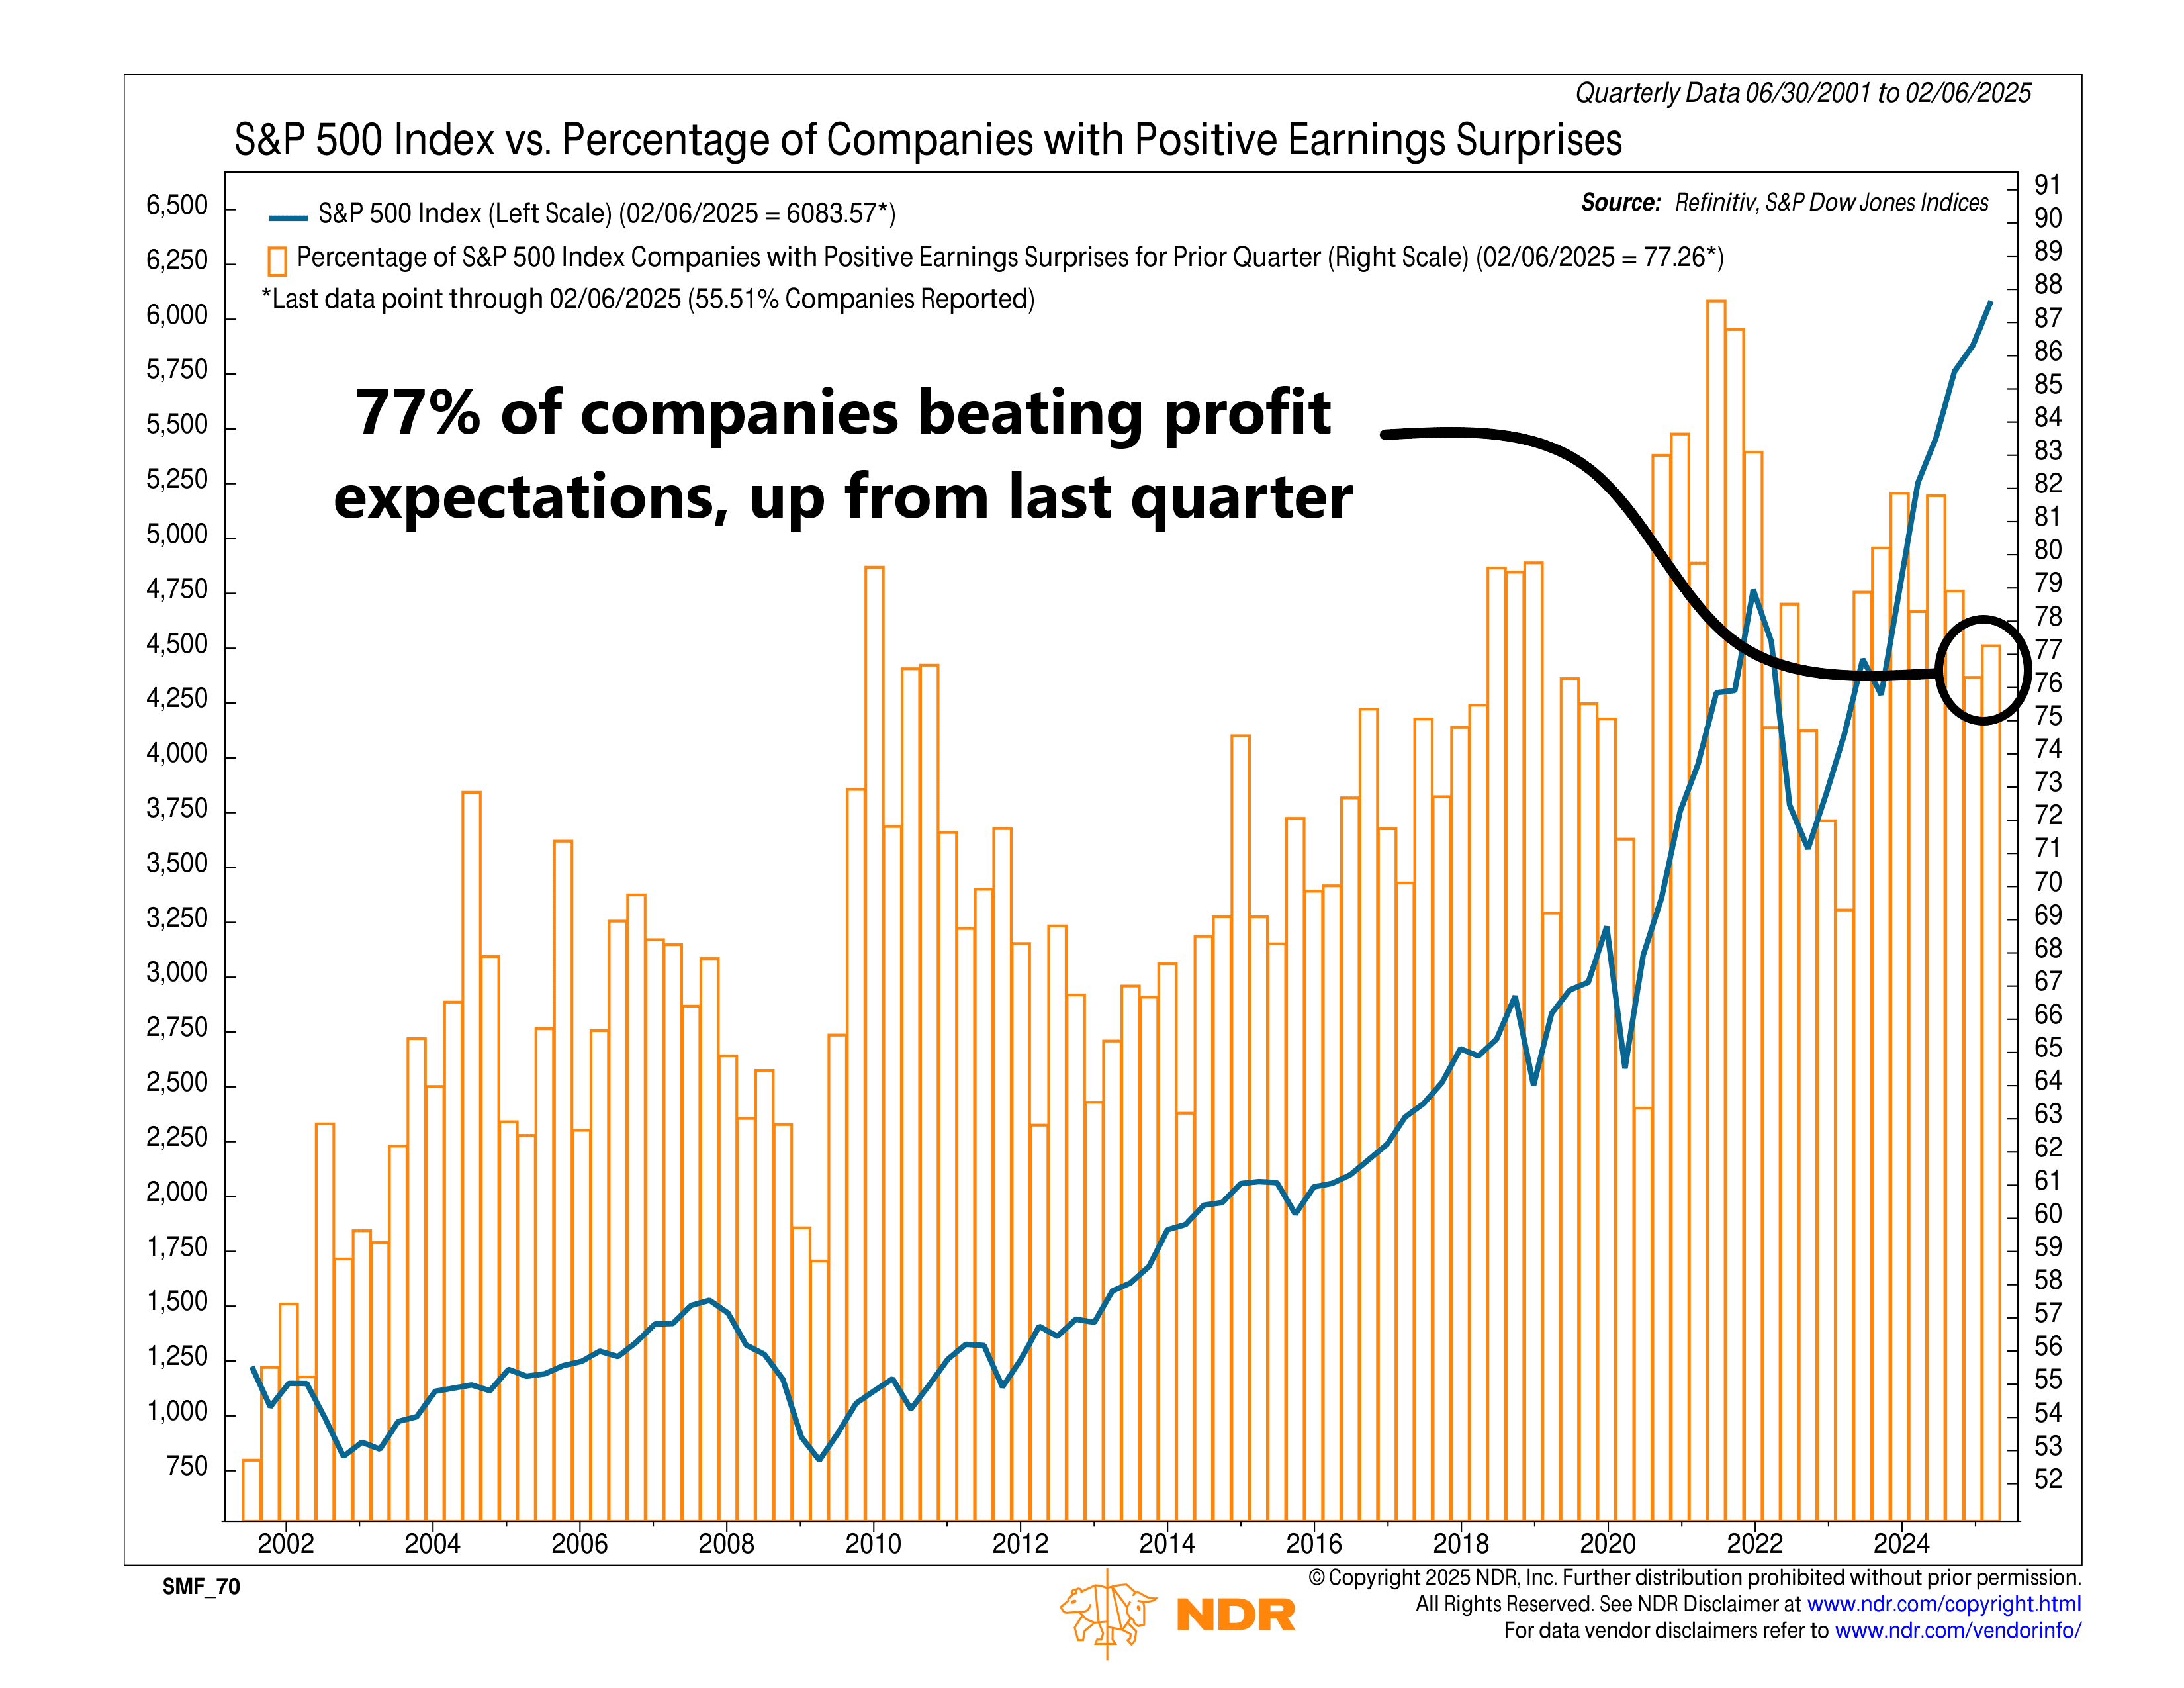
The real standout, though, is earnings growth. Right now, Q4 profits are tracking at 13.2%. If that momentum holds, it’ll be the strongest quarter in four years—a clear sign that corporate America is still thriving, even as the market hesitates.
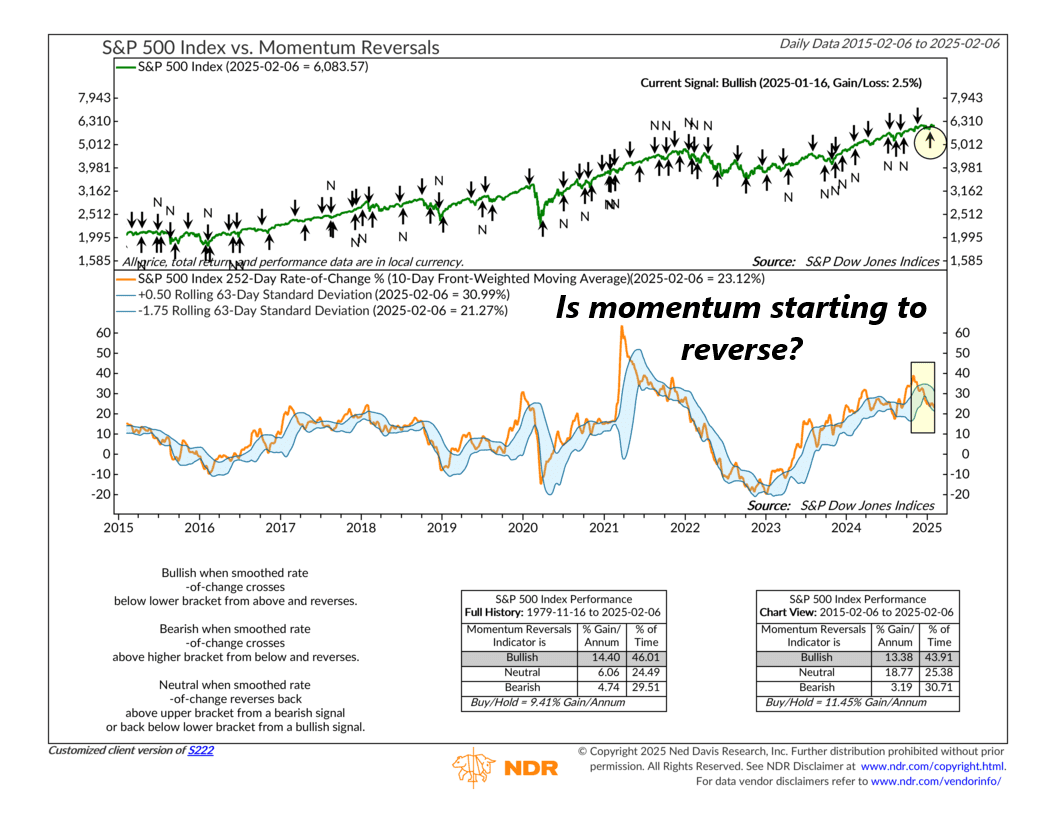
Meanwhile, our models are showing an uptick in stock momentum. As the next chart highlights, the S&P 500’s one-year momentum has recently shown signs of a turnaround, even though it remains in a moderate downtrend. This little spurt has helped lift our overall model’s reading, suggesting some underlying strength in the market.
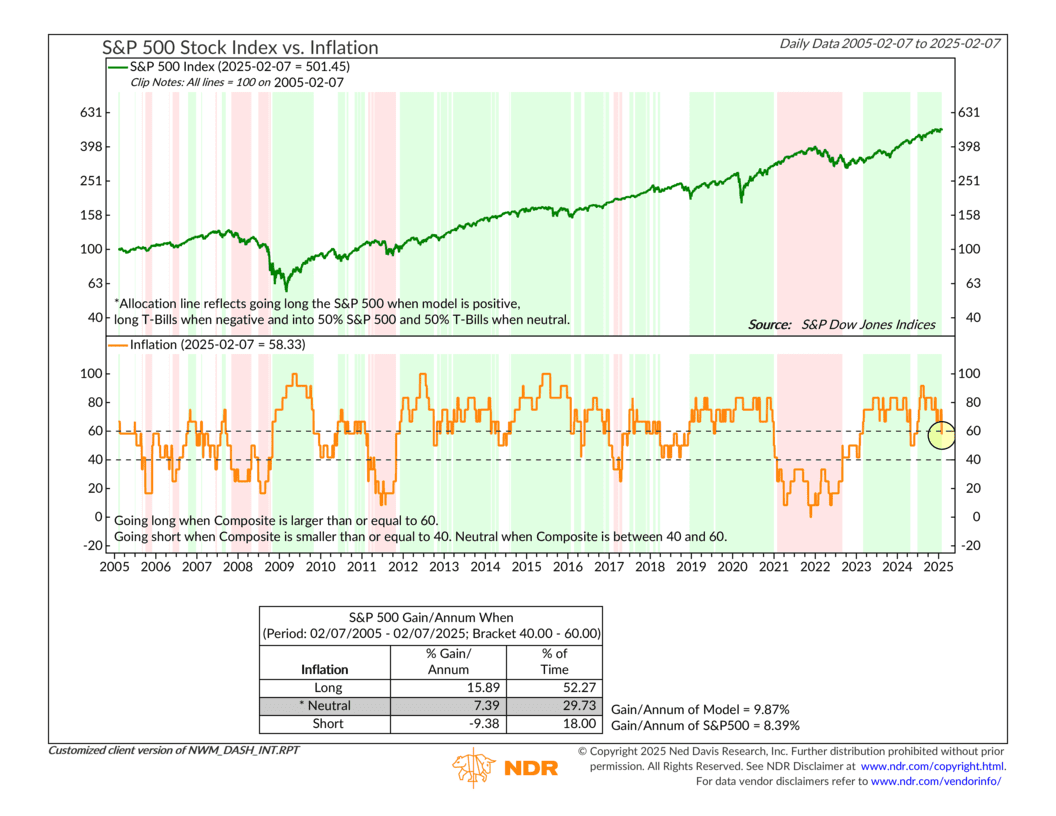
But not everything is moving in the right direction. One key factor that had been a steady tailwind for stocks—inflation—has started to shift. As our Inflation Composite shows, rising costs in commodities and the ISM Price Index are adding pressure, causing this part of our model to weaken.
So where does that leave us? The market is in a holding pattern, waiting for its next catalyst. Earnings are strong, momentum is improving, but inflation could be an emerging headwind. The tug-of-war between these forces will likely determine whether the market finally sets sail—or stays tethered to the dock a little longer.
This is intended for informational purposes only and should not be used as the primary basis for an investment decision. Consult an advisor for your personal situation.
Indices mentioned are unmanaged, do not incur fees, and cannot be invested into directly.
Past performance does not guarantee future results.
The S&P 500 Index, or Standard & Poor’s 500 Index, is a market-capitalization-weighted index of 500 leading publicly traded companies in the U.S.