OVERVIEW
U.S. stocks had another strong week, with the S&P 500 up 0.62%, the Dow gaining 0.59%, and the Nasdaq adding 0.95%. Value stocks outperformed growth, climbing 0.82% compared to 0.36%. Small caps lagged, rising only 0.22%.
International markets outshined the U.S., as developed markets rose 3.54% and emerging markets surged 6.15%. The U.S. dollar slipped 0.25%.
Bonds faced some pressure as the 10-year Treasury yield increased to 3.75%, leading to a 0.4% drop in long-term Treasuries. However, the overall bond market held steady for the week.
In the real asset space, real estate saw moderate losses of 1.15%, while commodities gained around 2.15%. Gold inched up 0.83%, corn jumped 4.04%, and oil fell 3.63%.
KEY CONSIDERATIONS
Follow the General – The market had a decent week. More stocks joined in on the rally, resulting in a big, bright buy signal from a closely watched market indicator.
Civil War buffs might recognize the name McClellan (the Union general). But, in fact, it has nothing to do with the Civil War general—and its track record is quite a bit better than George McClellan’s.
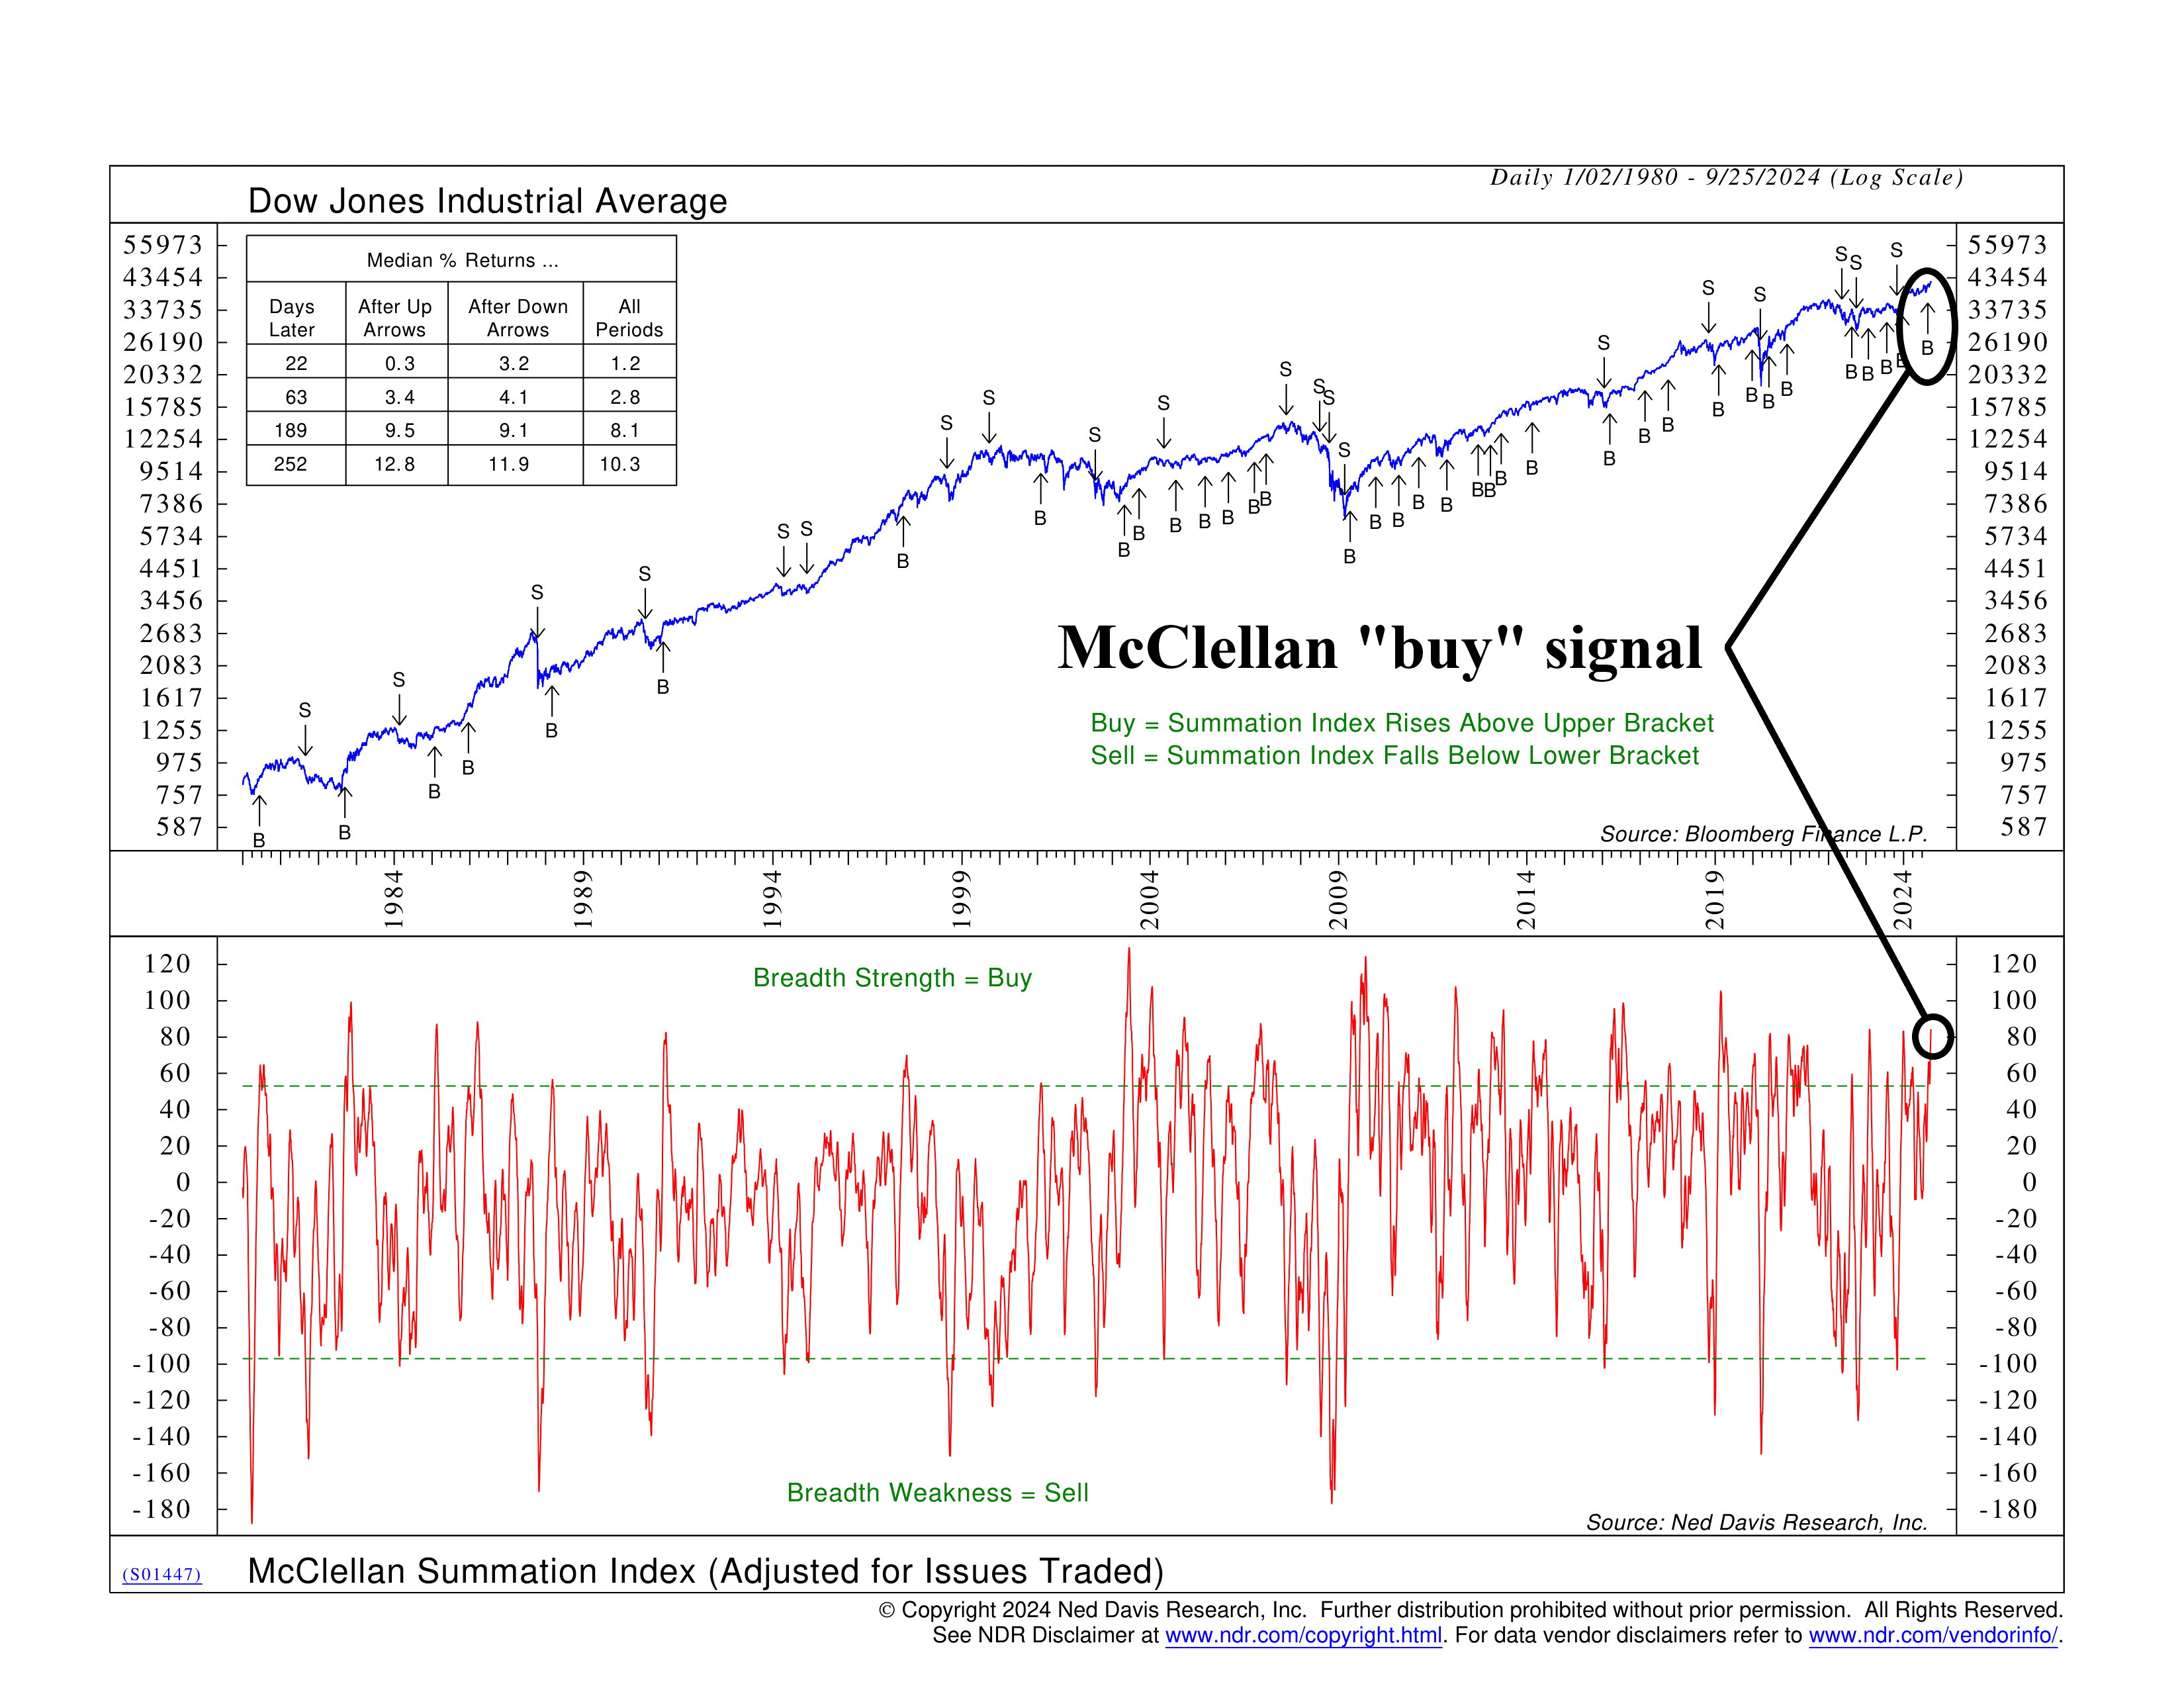
It’s called the McClellan Summation Index, named after Sherm McClellan, the stock market technician. The indicator measures market breadth by calculating a spread between the number of advancing and declining stocks. When it’s rising, it means more stocks are joining in a rally, and vice versa.
Here’s what it looks like:

As you can see, every time the index rises above the upper green line (marked by “B” arrows), the market tends to gain strength. In fact, past signals have shown a high probability of solid market gains within the next year. The median returns after a buy signal often hit double digits over 252 days.
We call this sort of market indicator a “thrust.” We know that, in the long run, the stock market tends to rise, but when it’s accompanied by a thrust, the probabilities go up significantly.
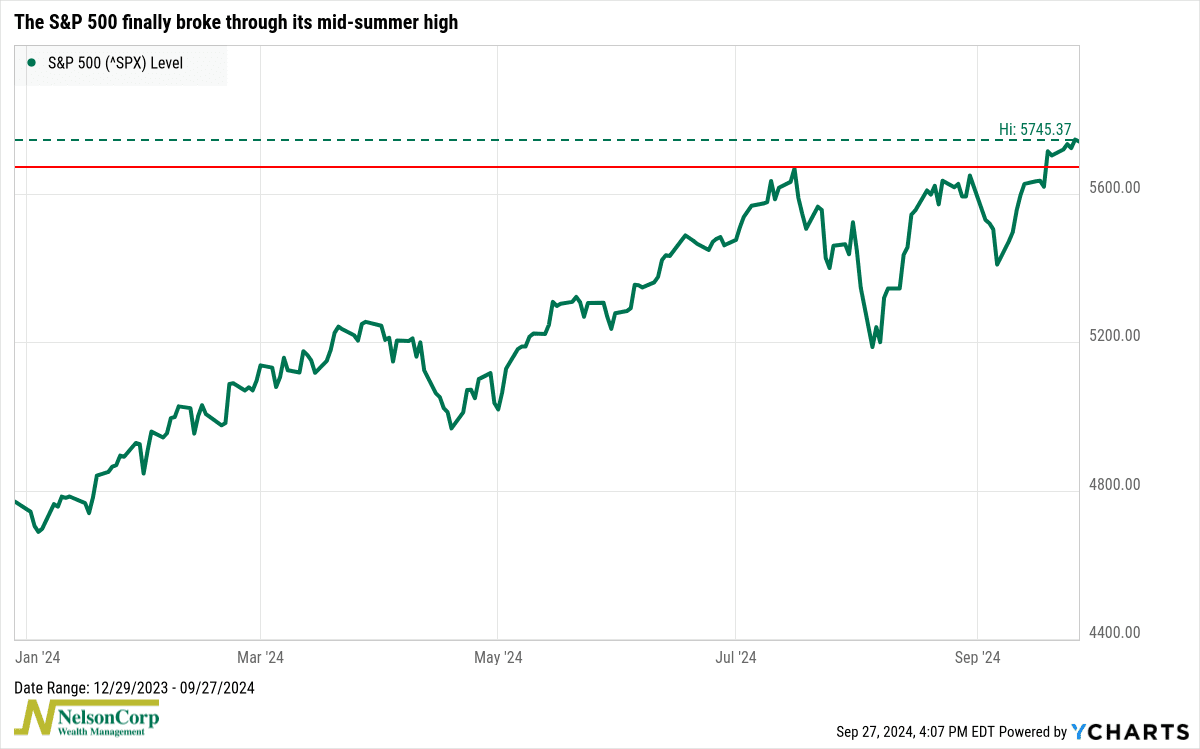
This is an important development because the stock market has been treading water since its mid-summer high point. But, after the recent surge, stocks are back to all-time highs.

So, I’ll keep it short and sweet. The bottom line is that the weight of the evidence is beginning to shift to the bullish side of the ledger. And if more thrust indicators like the McClellan turn positive, it could help keep this market moving higher.
This is intended for informational purposes only and should not be used as the primary basis for an investment decision. Consult an advisor for your personal situation.
Indices mentioned are unmanaged, do not incur fees, and cannot be invested into directly.
Past performance does not guarantee future results.
The S&P 500 Index, or Standard & Poor’s 500 Index, is a market-capitalization-weighted index of 500 leading publicly traded companies in the U.S.
