OVERVIEW
U.S. stocks were mixed on a holiday-shortened week last week. While the S&P 500 rose 0.4% and the Dow gained 0.84%, the Nasdaq dropped 0.3%. Value stocks led the way, gaining 1.9% versus a 0.46% decline for growth stocks.
Foreign stock markets were mixed as well. Developed countries registered losses of about 0.2%, whereas emerging markets increased about 0.1%.
Bonds ticked up slightly for the week while the benchmark 10-year Treasury rate stayed steady at about 4.2%. Overall, bond prices rose about 0.4% for the week.
Real estate was the best-performing asset class, rising 2.26% for the week. Commodities also did well, rising about 0.8% broadly. Oil rose 2.7%, gold increased 2.6%, and corn gained 0.6%. The U.S. dollar managed a small gain of about 0.18%.
KEY CONSIDERATIONS
Going Yard – Baseball is back! Opening Day was last week, officially kicking off the start of the MLB season. I’m sure a lot of fans around the country are pumped to watch their favorite team (hopefully) hit plenty of home runs this year.
In baseball, the slang term for hitting a home run is “going yard.” If we were to apply that to the stock market, we’d say it’s been “going yard” for many weeks now.
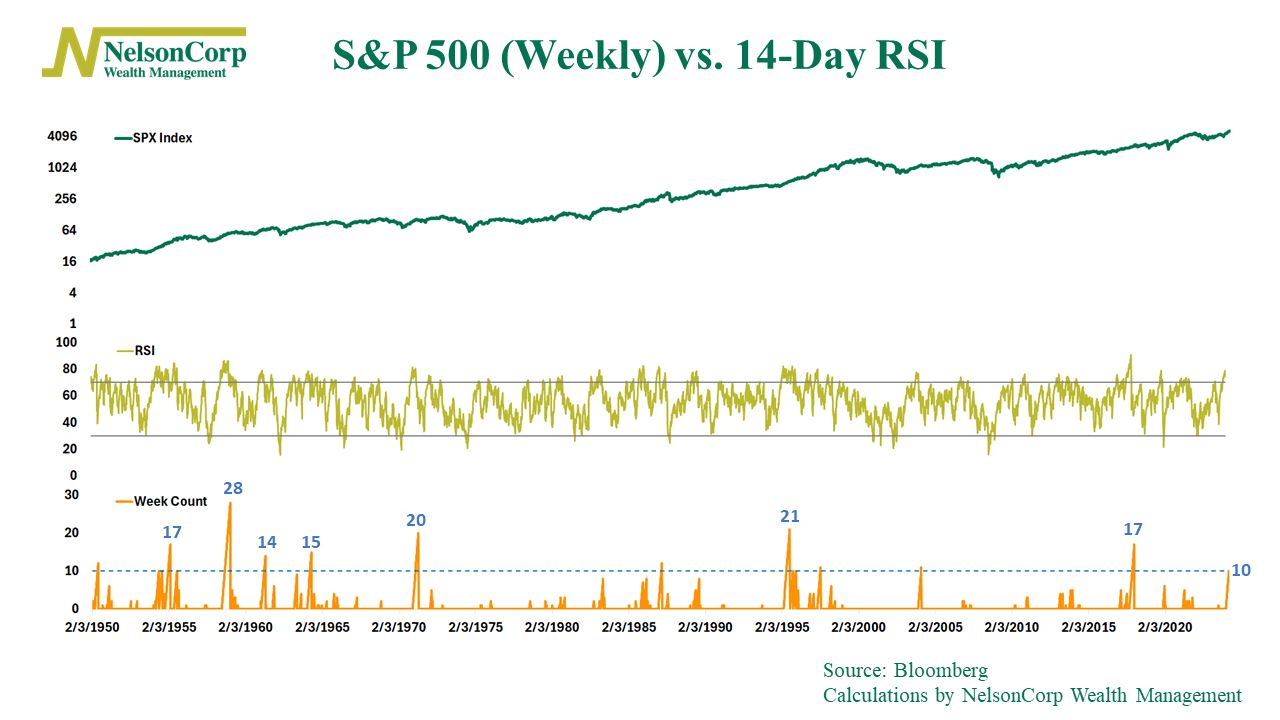
For example, the 14-day Relative Strength Index (RSI) reading for the S&P 500 Index has been above 70 for 10 straight weeks.

Usually, readings above 70 indicate an “overbought” market, meaning prices are due for a pullback. However, as you can see on the chart above, some other previous streaks in history have lasted even longer. And on average, those overbought streaks have seen the S&P 500 gain 15% more over the next year.
In other words, “overbought” sounds bad because it implies unsustainable buying. But it really just means that price gains have been stronger than usual. And as the legendary investor Alan Shaw once said, “The most bullish thing a market can do is get overbought and stay that way.”
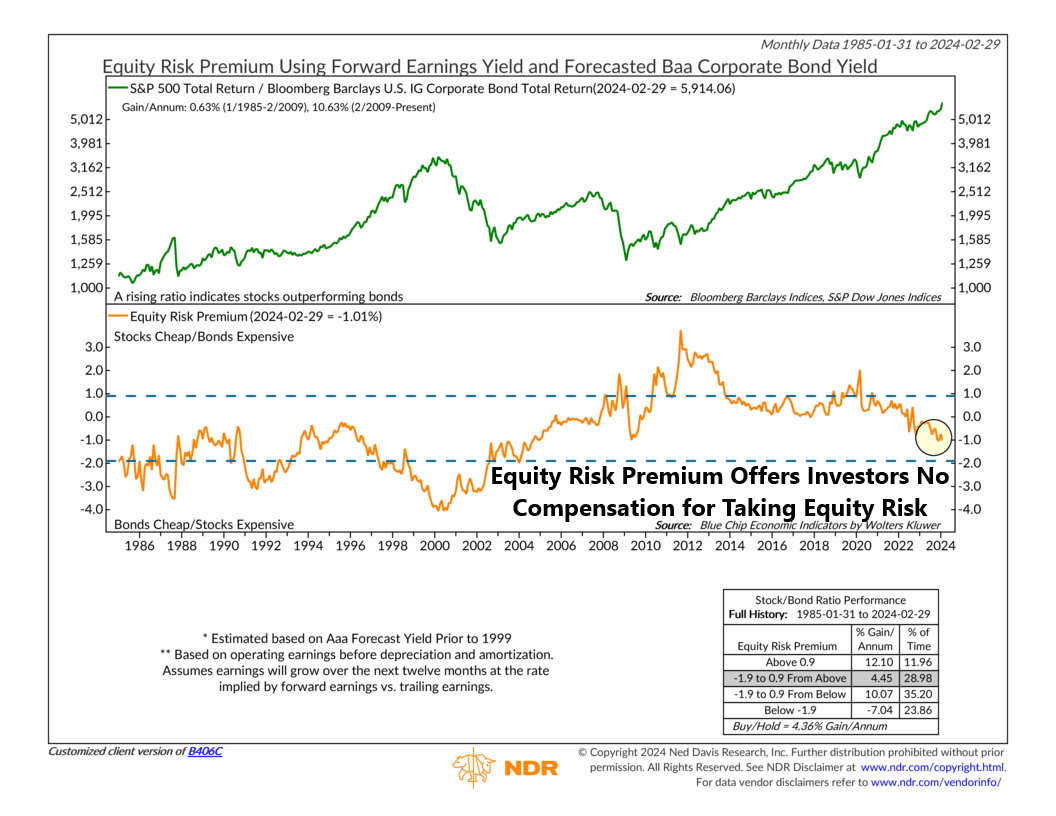
So, history says we shouldn’t necessarily be worried that the market will fail just because recent gains have been strong. However, if you were looking for a reason to be bearish, you could point out that, according to the so-called equity risk premium, stocks no longer offer compensation to investors for taking on equity risk.
What do I mean by that? Well, the equity risk premium is this idea that stocks should provide investors with an extra return compared to safer assets like bonds to compensate for their riskiness. We calculate it by comparing the expected earnings from stocks (the S&P 500’s earnings yield) to the income (or yield) offered by high-quality bonds. This is shown as the orange line on the chart below.

Back in March 2020, at the depths of the pandemic lockdown, the equity risk premium was high, meaning stocks offered tremendous value relative to bonds. As the stock/bond ratio (green line) on the top of the chart shows, stocks have outperformed bonds strongly ever since.
Today, however, the equity risk premium is actually negative (about -1.01%). So, compared to bonds, stocks offer much less strategic value today than four years ago.
Does this mean stocks can’t do well in this sort of environment? Certainly not. But it does provide a counterpoint to the strong price gains we’ve seen recently. To be fair, the weight of our model evidence still leans to the bullish side. But going back to our baseball analogy, even the best hitters hit a slump every now and then—so it pays to be prepared.
This is intended for informational purposes only and should not be used as the primary basis for an investment decision. Consult an advisor for your personal situation.
Indices mentioned are unmanaged, do not incur fees, and cannot be invested into directly.
Past performance does not guarantee future results.
The S&P 500 Index, or Standard & Poor’s 500 Index, is a market-capitalization-weighted index of 500 leading publicly traded companies in the U.S
