OVERVIEW
It was a mixed week for U.S. stocks. While the Dow gained 0.72%, the S&P 500 dropped 1.97% and the Nasdaq slipped 3.65%.
Growth stocks led the decline, falling 3.75%, whereas value stocks rose about 0.85%. Small-cap stocks did well, rising 2.22%.
Foreign stocks didn’t hold up any better. Developed countries fell 2.4%, and emerging markets dropped 3%.
Bonds fell slightly as the yield on the benchmark 10-year Treasury rose to 4.24%.
Commodities also struggled, with overall declines exceeding 3%. Oil was a significant contributor to this, falling by about 2.8%.
However, the U.S. dollar strengthened by 0.45%, and real estate saw a gain of approximately 1.5%.
KEY CONSIDERATIONS
Greedy Investors – Last week was a challenging one for the S&P 500. After a relatively calm summer, the index dropped pretty abruptly.
To provide some perspective, here’s the year-to-date drawdown for the S&P 500:
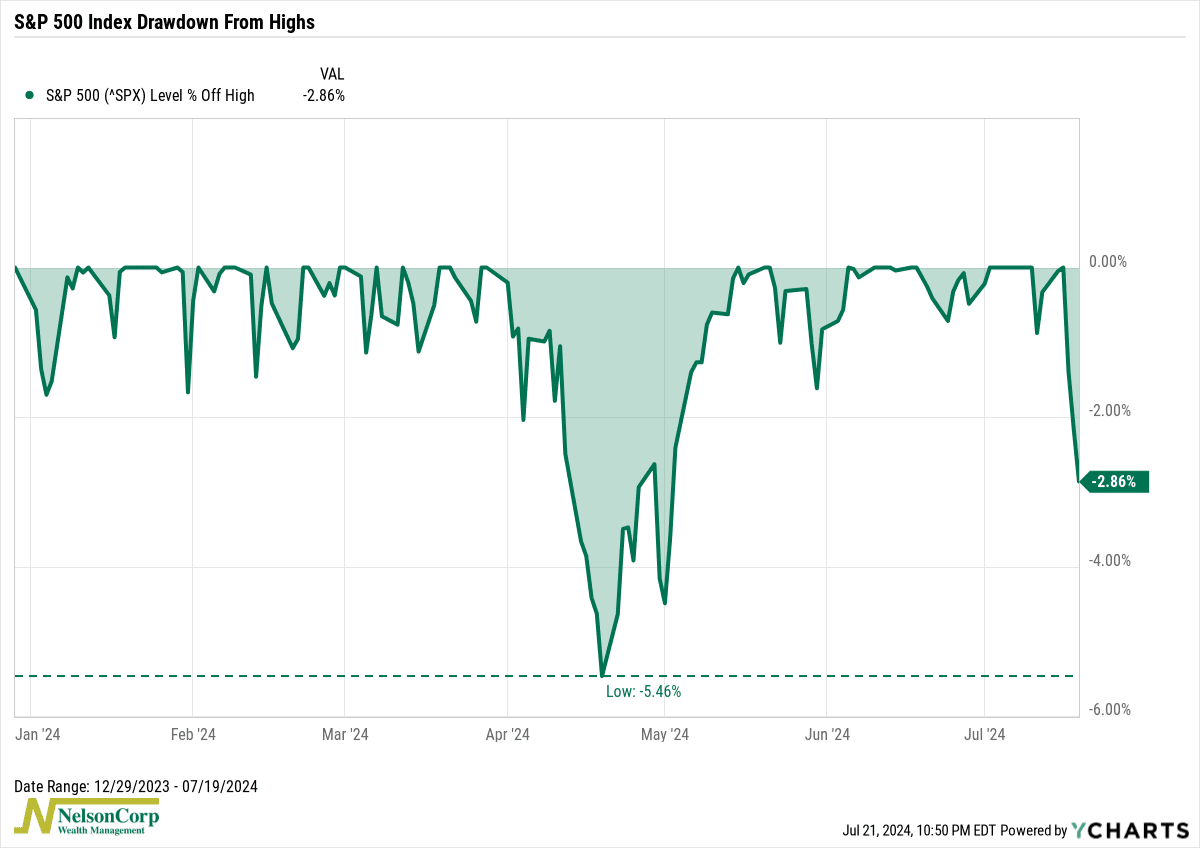
At 2.86%, this is only half of what we saw back in April. While this might not seem alarming, it’s worth noting that the April drawdown was relatively mild. Could more weakness be on the horizon?
It’s hard to say. But one thing our models have been warning us about is excessive investor optimism.
For example, the percentage of bullish investors in the AAII Sentiment Survey—shown below—jumped to multi-year highs last week.
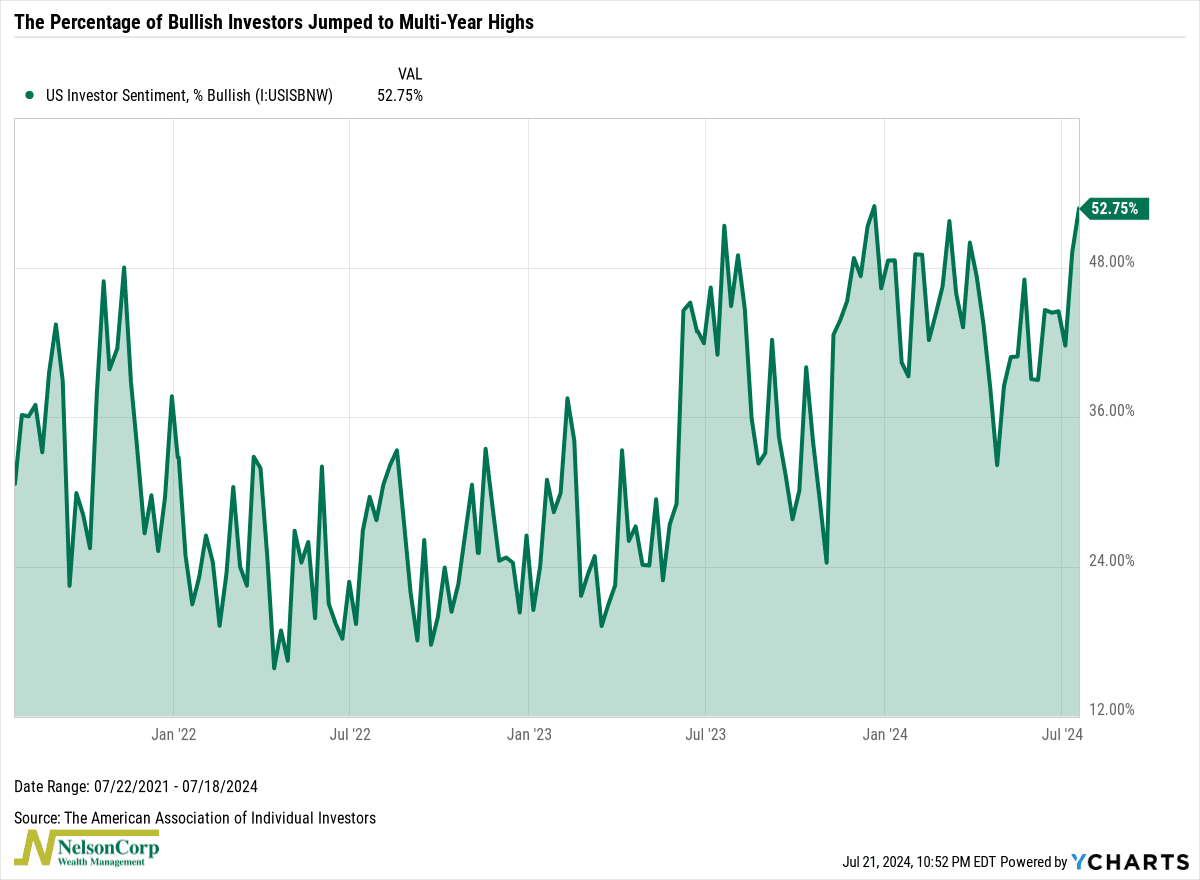
It’s perhaps no surprise, then, that this coincided with a minor pullback in the S&P 500.
Why? Because historically, extreme optimism has often preceded weaker market returns.
The real concern, however, arises when there’s a reversal from this peak optimism. A more significant market pullback typically follows this, so that is something to keep in mind.
The good news, however, is that once this pullback has run its course, it could present a better buying opportunity—but only if the other areas of our models have improved enough to balance out the risks.
That’s the key; that’s what we’ll be watching for.
This is intended for informational purposes only and should not be used as the primary basis for an investment decision. Consult an advisor for your personal situation.
Indices mentioned are unmanaged, do not incur fees, and cannot be invested into directly.
Past performance does not guarantee future results.
The S&P 500 Index, or Standard & Poor’s 500 Index, is a market-capitalization-weighted index of 500 leading publicly traded companies in the U.S.