OVERVIEW
Markets finished higher last week, reversing some recent weakness. The S&P 500 rose 0.51%, while the Dow Jones Industrial Average led with a 1.20% gain. The tech-heavy Nasdaq saw a more modest move, up 0.17%.
Small- and mid-cap stocks also participated in the rally. The S&P 600 (small-cap) advanced 0.60%, and the S&P 400 (mid-cap) climbed 0.64%. The broader market followed suit, with the Russell 3000 up 0.64%, though growth stocks lagged slightly, with the Russell 3000 Growth index up just 0.32%.
International markets outperformed U.S. equities. Developed markets (EAFE) gained 0.75%, while emerging markets rose 1.05%. The U.S. dollar posted a 0.39% weekly gain.
Bond markets were broadly positive. Long-term Treasuries rose 0.64%, and short-term Treasuries inched up 0.09%. Investment-grade bonds gained 0.63%, and high-yield bonds added 0.43%.
Commodities had a strong showing. Broad commodities rose 0.38%, oil jumped 2.09%, and gold continued its impressive run, gaining 0.64%. Corn also added 1.25% on the week.
KEY CONSIDERATIONS
Guessing Game – Let’s play a little game: where do you think the S&P 500 will end the year? If you guessed somewhere between 5,500 and 7,100, great job! That’s the range of estimates from Wall Street’s top strategists, as you can see on the chart below.
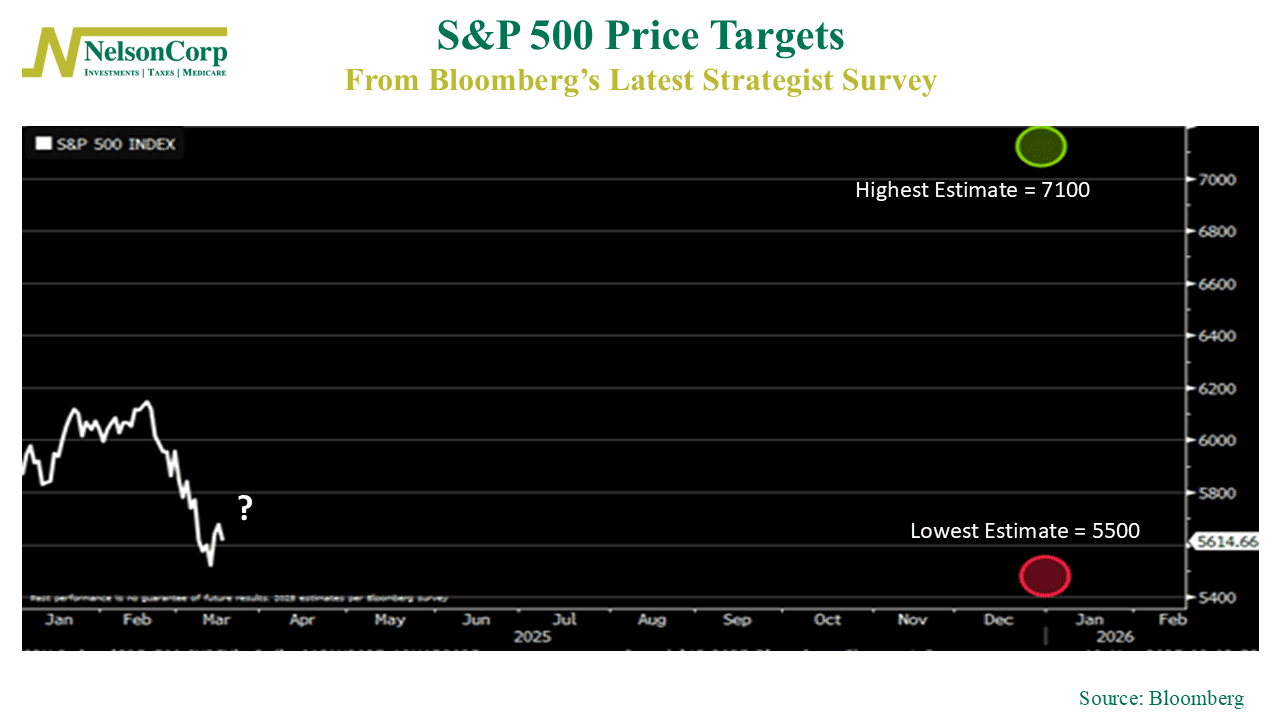
But those estimates are pretty wide, right? The green circle represents the most bullish target, while the red circle marks the most bearish outlook. There’s obviously a lot of uncertainty surrounding the current market environment.
But here’s the thing—at around 5,600 on the S&P 500 Index, we’re already flirting with the lower end of that range. Is this where we will end the year?
It’s possible. But we prefer to let the data do the talking, so let’s turn to our primary stock market risk model for some clues. This next chart shows how the positive-to-negative ratio of the 108 indicators comprising the model has evolved over time. Historically, whenever there have been at least 1.5 positive indicators for every 1 negative indicator, it has coincided with a strong market environment.
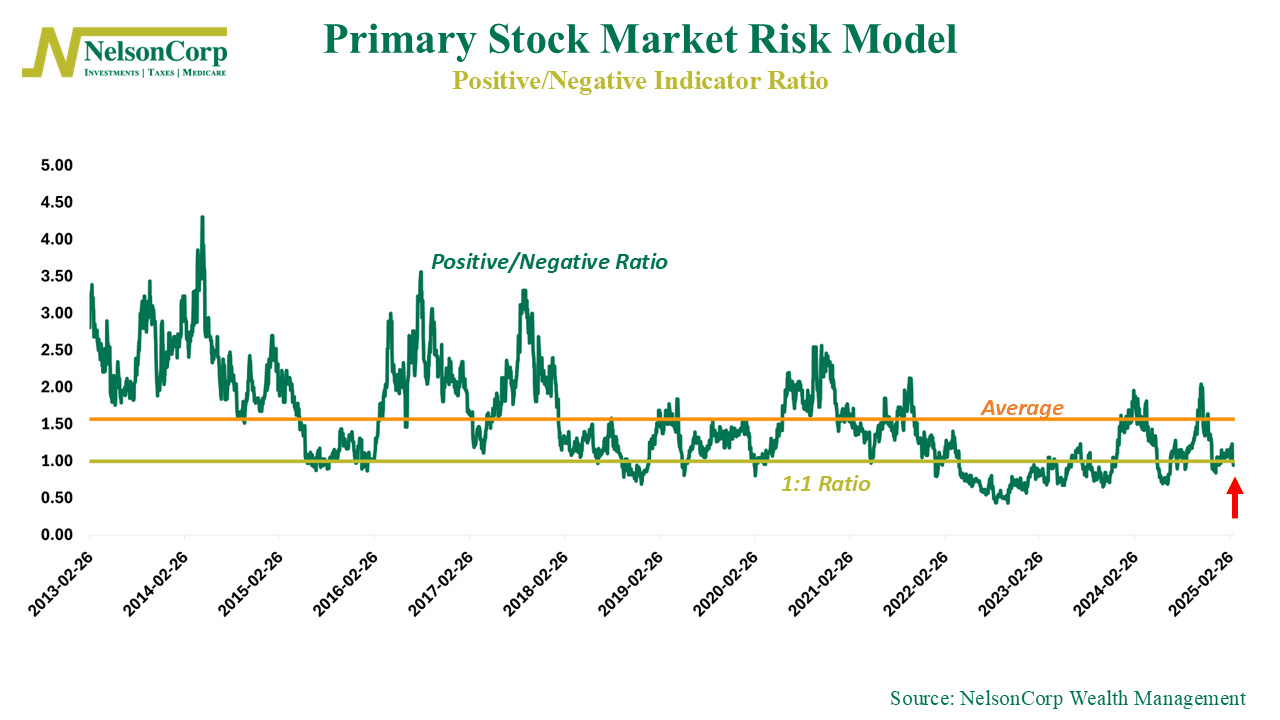
Where are we now? Well, as you can see on the chart, it’s not looking great. The ratio is well below the long-run average of 1.5—and despite a small recent surge, it’s still below a 1:1 ratio, meaning positive indicators aren’t outpacing the negatives. If we’re going to feel comfortable adding more stock risk, we’ll need to see this ratio improve and sustain itself above average levels. Until then, patience is key.
In the meantime, the VIX index can be a useful tool to use alongside our risk model for added context. Right now, the VIX—or Wall Street’s “fear gauge”—is hovering just under 20, not far from its long-run average of 19.5.
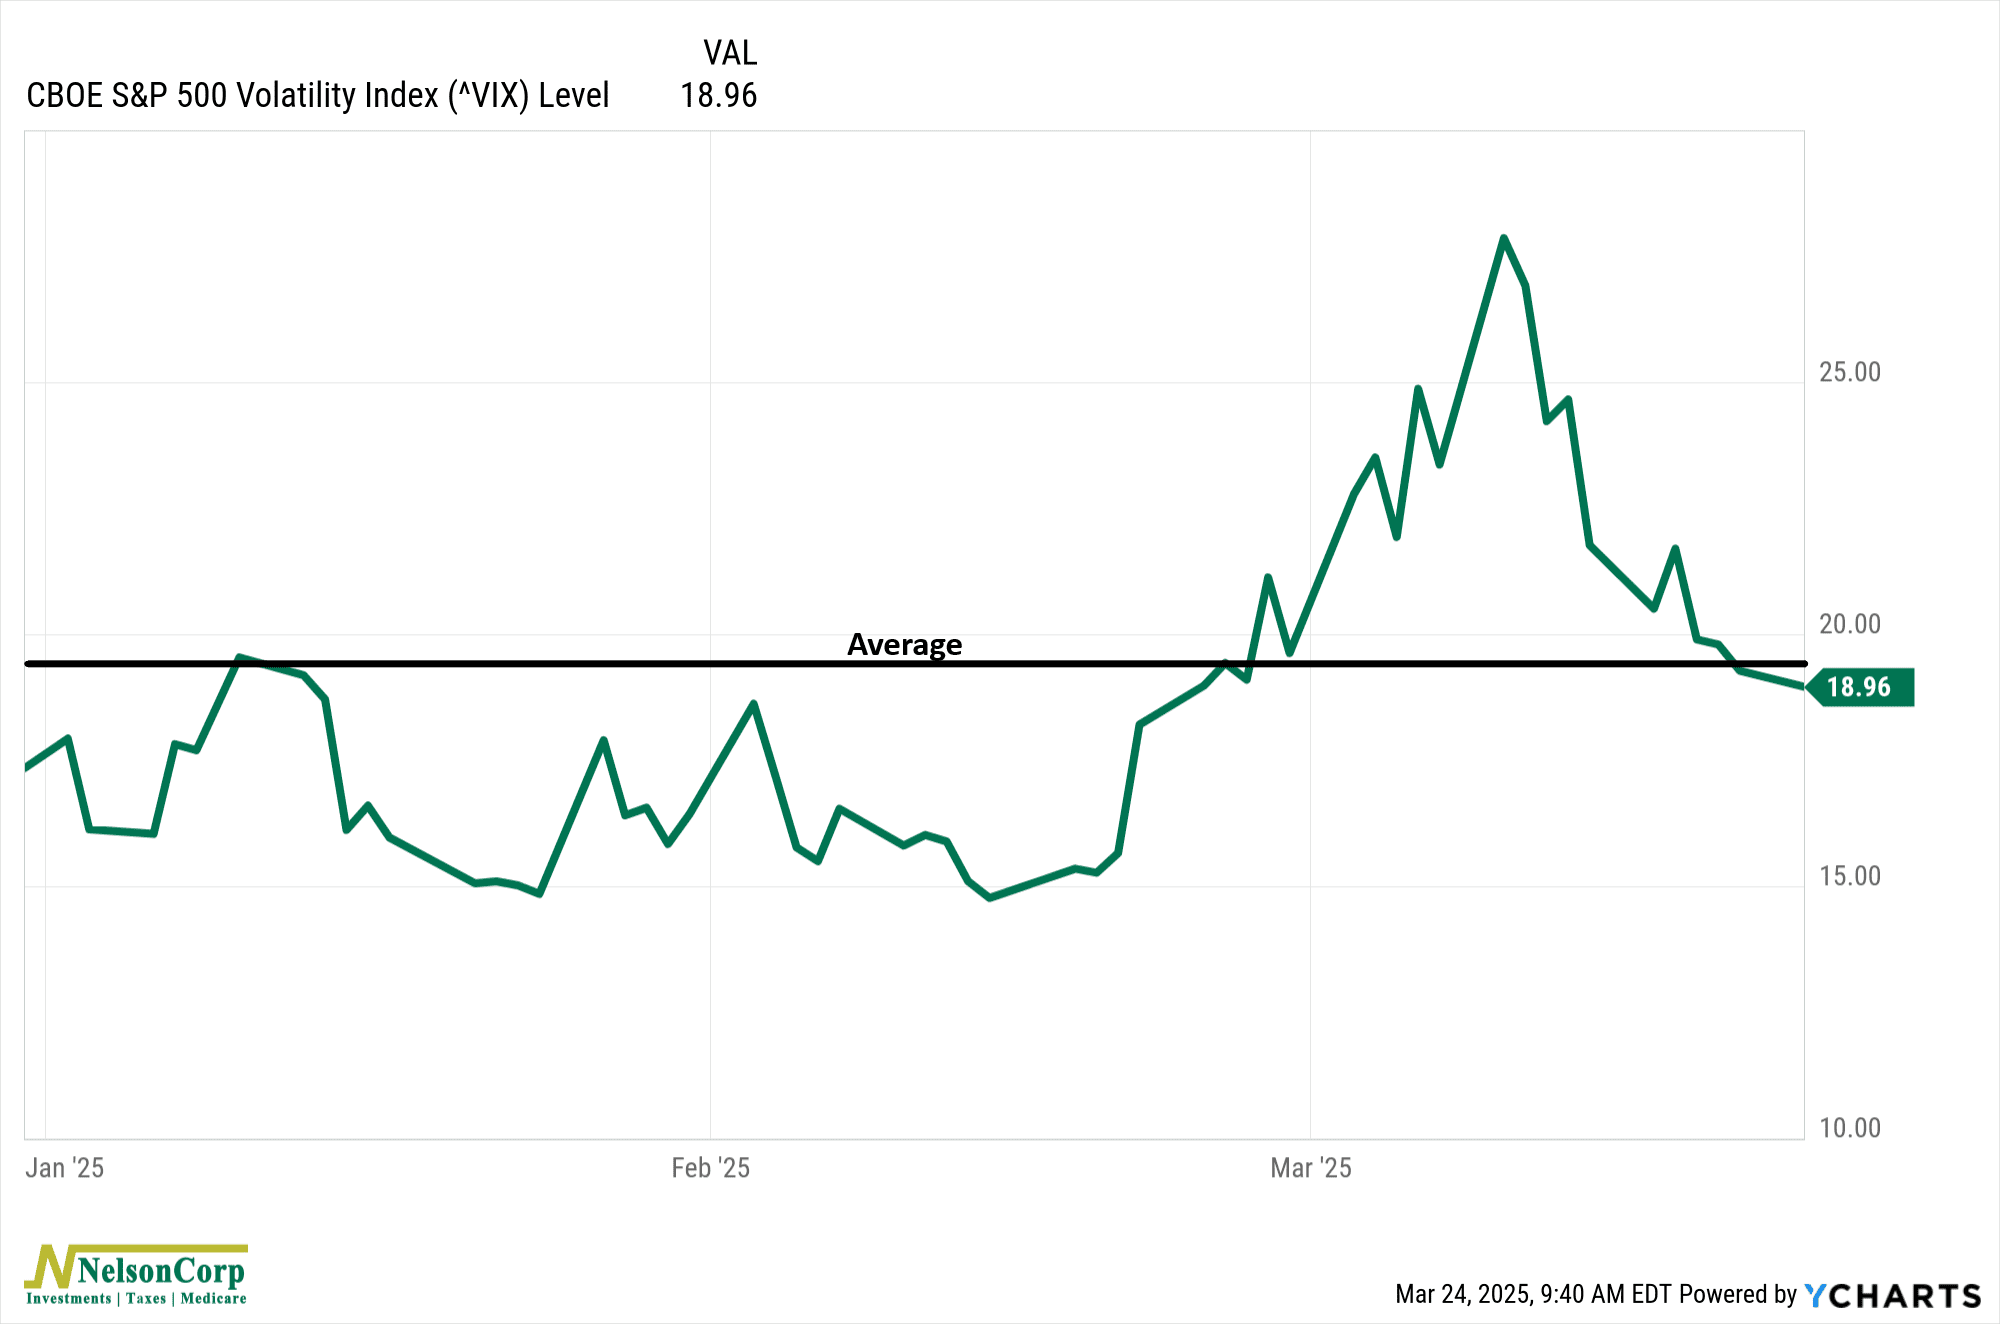
The key levels to watch here are around 36 and the long-run average of 19.5. Historically, when the VIX spikes to around 36 (two standard deviations above the mean), that’s when the Fed has been more likely to step in with support. In other words, if we see another leg down in stocks that sends the VIX soaring, policymakers may feel the pressure to act.
By contrast, if the VIX drops below 19.5 and stays there, that would be a positive signal that market turbulence is fading—something we’ll be watching closely as we head toward quarter-end.
So, the bottom line is that we’re already near the lower bound of Wall Street’s year-end S&P 500 targets, but our models suggest we’re not in the clear just yet. The positive-to-negative indicator ratio still needs to show improvement before we get more aggressive on stocks. Meanwhile, the VIX is holding steady, but a sustained drop below 19.5 would be a strong signal that the worst of the market weakness is behind us.
For now, we’re keeping an eye on the data and waiting for a better setup. The market is full of surprises, but as always, we’ll be ready when the right opportunities arise.
This is intended for informational purposes only and should not be used as the primary basis for an investment decision. Consult an advisor for your personal situation.
Indices mentioned are unmanaged, do not incur fees, and cannot be invested into directly.
Past performance does not guarantee future results.
The S&P 500 Index, or Standard & Poor’s 500 Index, is a market-capitalization-weighted index of 500 leading publicly traded companies in the U.S.