OVERVIEW
It was a positive week for U.S. stocks. The S&P 500 gained 0.87%, marking its 35th record high of the year. The Dow performed even better, rising 1.6%, while the Nasdaq lagged with a 0.25% increase.
Growth stocks dipped by 0.26%, whereas value stocks saw a gain of around 2.8%. Small-cap stocks were the standout performers, surging nearly 5.4% for the week.
Foreign stocks also had a strong week, with developed markets increasing by 2.4% and emerging markets by 1.47%. The U.S. dollar declined approximately 0.66% against other currencies.
Bonds performed well as Treasury yields decreased across the curve, leading to a 0.74% rise in the Bloomberg U.S. Aggregate Index.
Real assets showed mixed results: real estate soared by about 4.4%, while commodities overall declined by 0.5%. Gold and corn rose by 2.5% and 2.3% respectively, but oil fell by about 0.2%.
KEY CONSIDERATIONS
Markets Rise; Risks Persist – It was another interesting week on Wall Street. As we pointed out in our Chart of the Week, inflation came in cooler than expected on Thursday. The Consumer Price Index actually fell last month, the first time it’s done that since 2020.
That means the market might finally be getting the rate cuts it was promised. According to the CME Group FedWatch tool, shown below, the odds of a rate cut at the Fed’s September meeting have jumped to more than 88%.
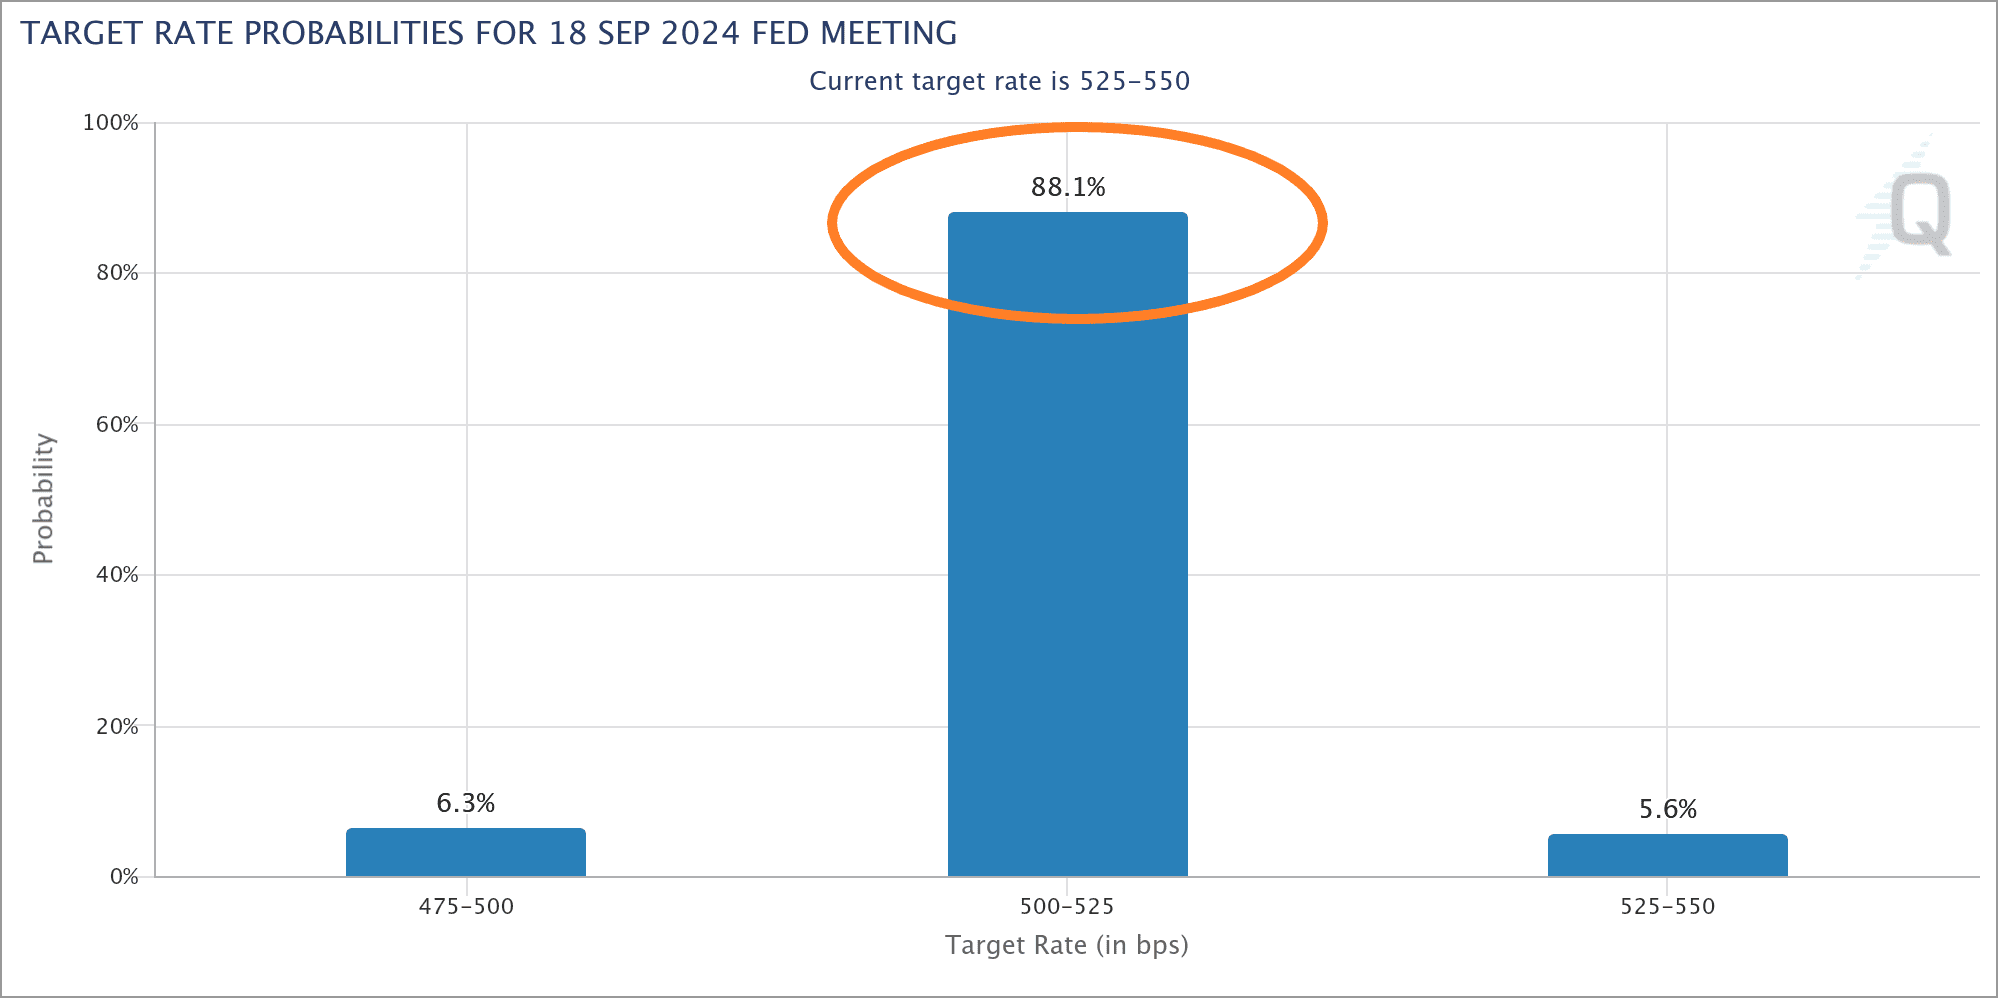
In other words, it’s pretty much a done deal that rates will be heading lower at this point.
That’s most likely good news for bonds. Bond math says falling rates lead to higher prices—like a teeter-totter.
But what about stocks? How will they react? That’s harder to say. The range of outcomes for how the market has done after the first Fed rate cut is pretty wide.
But if we look at what the market is doing today, we see that it’s holding up pretty well. After a steep drop in our Momentum Composite over the past few months, shown below, it has seemingly turned a corner and has since rebounded.
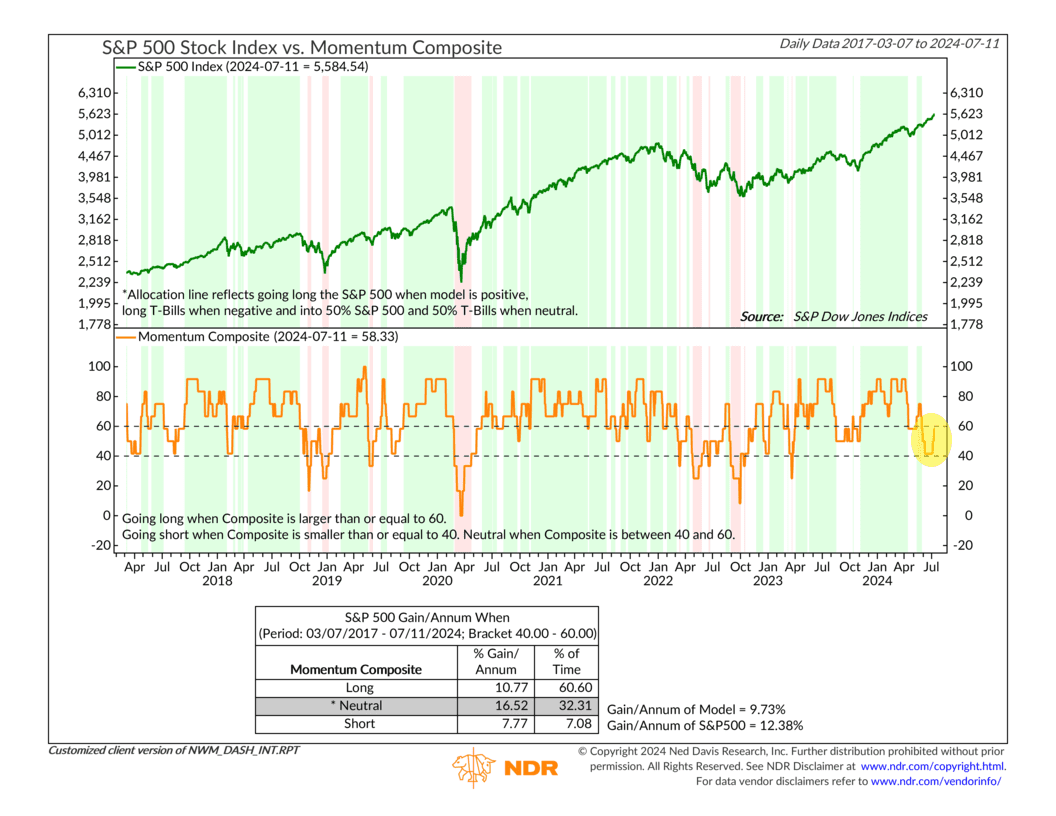
We like to see that; that’s good news. However, the concern is that it might also reinforce the idea that investors are becoming complacent.
For example, the put/call ratio, shown below, has fallen to pretty low levels in recent weeks.
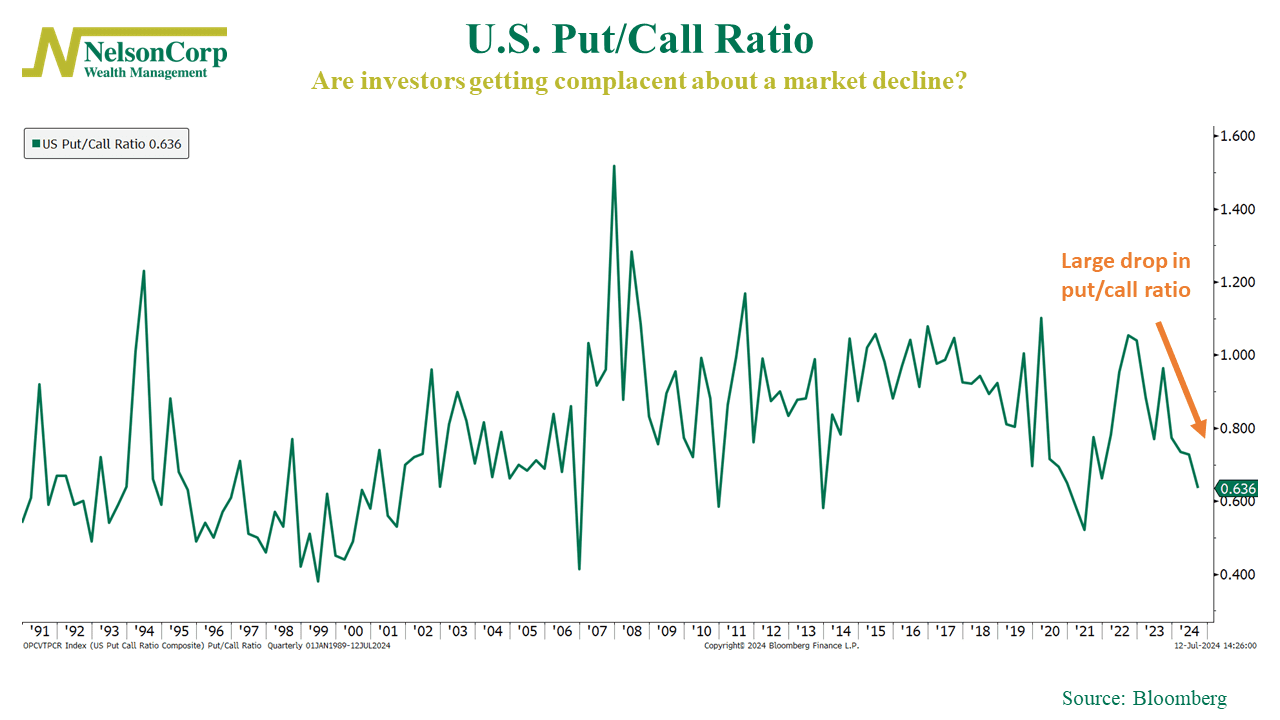
This is concerning because the put/call ratio is a metric used to gauge investor sentiment by comparing the number of put options (bets that prices will fall) to call options (bets that prices will rise). A high ratio suggests bearish sentiment, while a low ratio indicates bullish sentiment.
In other words, a low put/call ratio means investors are trading as if they aren’t concerned about a market pullback—which, in and of itself can set the market up for big drop because there is no one left to buy. Indeed, historically, we’ve found that when the put/call ratio falls to low levels and reverses, it tends to lead to lower-than-average stock market returns.
The bottom line? While the stock market continues its upward trajectory, heightened optimism and overbought conditions have left it vulnerable to a potential setback or correction. Cautious optimism is advised until some of these conditions have been relieved.
This is intended for informational purposes only and should not be used as the primary basis for an investment decision. Consult an advisor for your personal situation.
Indices mentioned are unmanaged, do not incur fees, and cannot be invested into directly.
Past performance does not guarantee future results.
The S&P 500 Index, or Standard & Poor’s 500 Index, is a market-capitalization-weighted index of 500 leading publicly traded companies in the U.S.