OVERVIEW
U.S. stocks were mixed last week, with the S&P 500 rising 0.32% and the Nasdaq gaining 2.51% but the Dow falling 1%.
Growth stocks emerged as the leaders among different stock categories, with a rise of 1.64%. Conversely, value stocks faced a decline of 1.17%. Small-cap stocks managed to achieve moderate gains of approximately 0.15%.
Overseas markets witnessed relatively poor returns. Developed country stocks slipped by 2.38%, and emerging markets experienced a loss of 0.45%.
The bond market struggled amid rising rates. The 10-year Treasury rate rose to 3.8% from 3.6% the week prior. Intermediate-term Treasuries lost around 0.74%, and long-term Treasuries fell about 0.6%. Both investment-grade and high-yield corporate bonds decreased roughly 0.35%. Municipal bonds were essentially flat for the week, and TIPS dropped about 0.5%.
Real assets were mostly down last week, with real estate falling 1.37% and commodities dropping nearly 1% broadly. Oil rose about 1.4%, corn increased nearly 9%, and gold fell 1.86%. The U.S. dollar had a strong performance, increasing by approximately 1.13%.
KEY CONSIDERATIONS
Positive Momentum Tempered by Excessive Optimisim – Last week, we pointed out that long-term momentum in the stock market has improved.
Additionally, we’ve seen signs that relative momentum has also improved considerably.
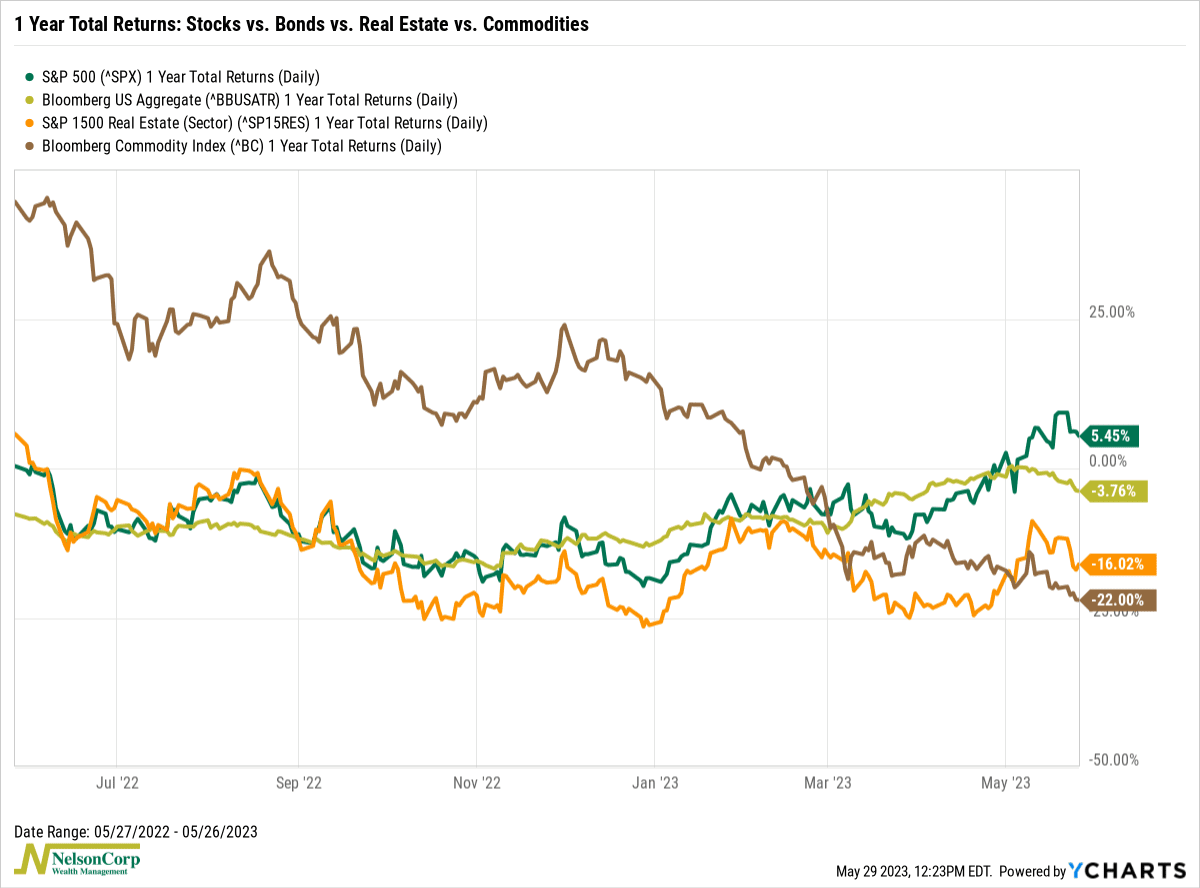
For example, the chart below shows the 1-year total returns for the following asset classes: stocks, bonds, real estate, and commodities.

As you can see, stocks (the green line) are the only major asset class on the chart with a positive 1-year total return. Bonds, real estate, and commodities are all in negative territory. Thus, from a technical momentum perspective, stocks appear more favorable than their counterparts, and that is likely bullish for stocks going forward.
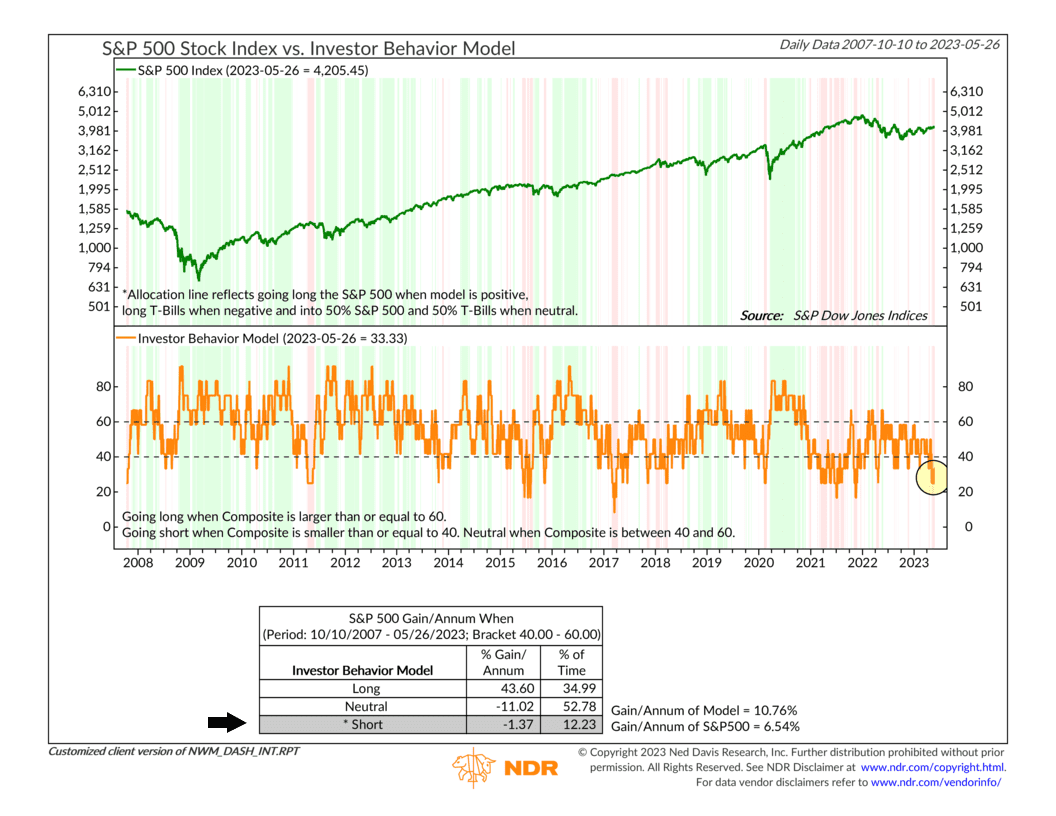
However, there is one thorn in the side of all this good news: our Investor Behavior Composite, shown below, has dipped into negative territory.

This composite is made up of contrarian indicators, where high readings—signaling excessive optimism—are negative for stock market returns and vice versa. And for the most part, most of the indicators are saying that investors are too optimistic to sustain above-average stock market returns.
So, the bottom line is that while there are reasons to be optimistic about stocks from a long-term technical momentum standpoint, the prevailing excessive optimism has the potential to constrain market returns. When combined with a moderately negative economic backdrop, we’d describe the current environment as cautiously neutral.
This is intended for informational purposes only and should not be used as the primary basis for an investment decision. Consult an advisor for your personal situation.
Indices mentioned are unmanaged, do not incur fees, and cannot be invested into directly.
Past performance does not guarantee future results.
