OVERVIEW
U.S. stocks rallied last week following a 50-basis-point rate cut from the Fed. The S&P 500 climbed 1.36%, the Dow rose 1.62%, and the Nasdaq gained 1.49%. Small-cap stocks led the charge, up about 2.2% for the week.
Global stocks also performed well, with developed markets inching up 0.42% and emerging markets jumping 2.23%. Meanwhile, the U.S. dollar slipped by 0.14%.
Bonds had a rougher week as the 10-year Treasury yield increased to 3.74% from 3.66%, causing the bond market to drop around 0.3%.
Real estate declined 0.86%, but commodities had a strong week, rising 2.05%. Oil led the way, up 4.4%, followed by gold’s gain of 1.36%. Corn dipped 2.78%.
KEY CONSIDERATIONS
Rate Cut – The big news on Wall Street last week was, of course, the rate cut. Everyone knew the Fed was going to cut rates. The question was: by how much?
The answer ended up being 50 basis points (0.5 percentage points).
This surprised a lot of people. Traditionally, the Fed has been a bit more cautious, so many analysts thought they’d only go with a 25 basis point reduction.
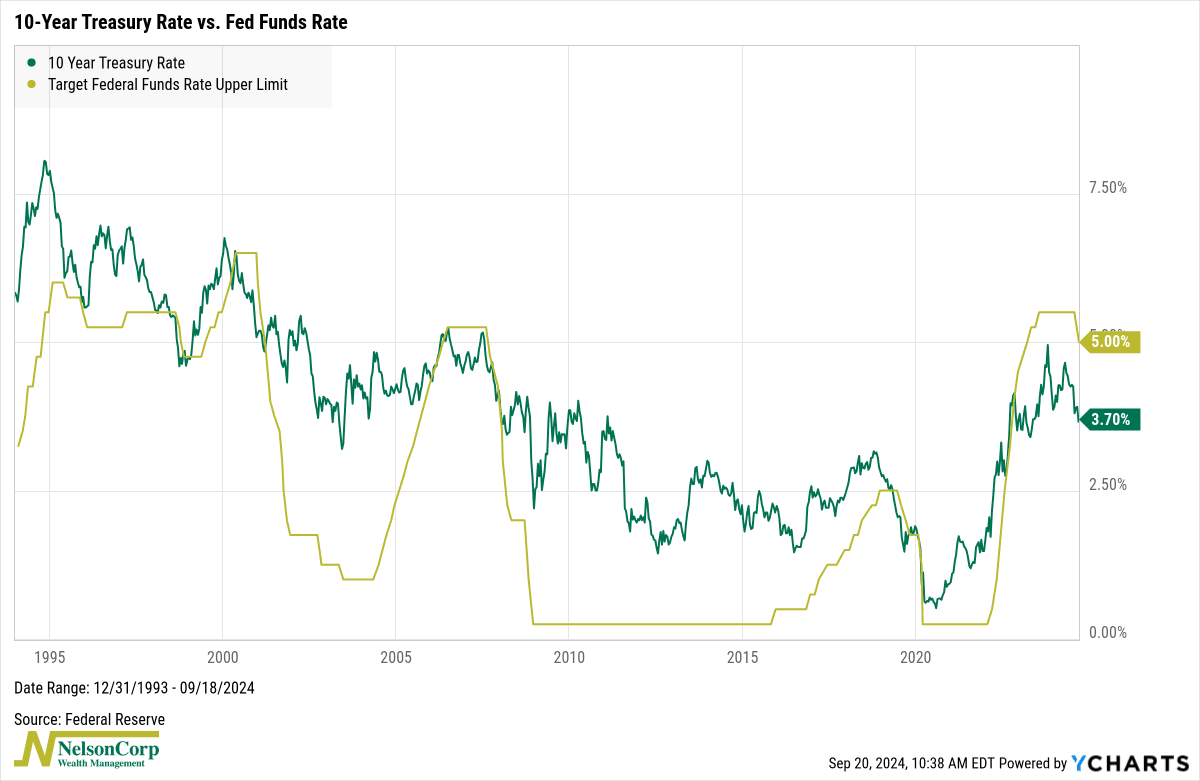
But, as we pointed out in this week’s Chart of the Week (shown below), the Fed was already playing catch-up. With the 10-year Treasury yield signaling lower rates for some time, the Fed needed to cut more aggressively to align with market expectations, and that’s exactly what they did.

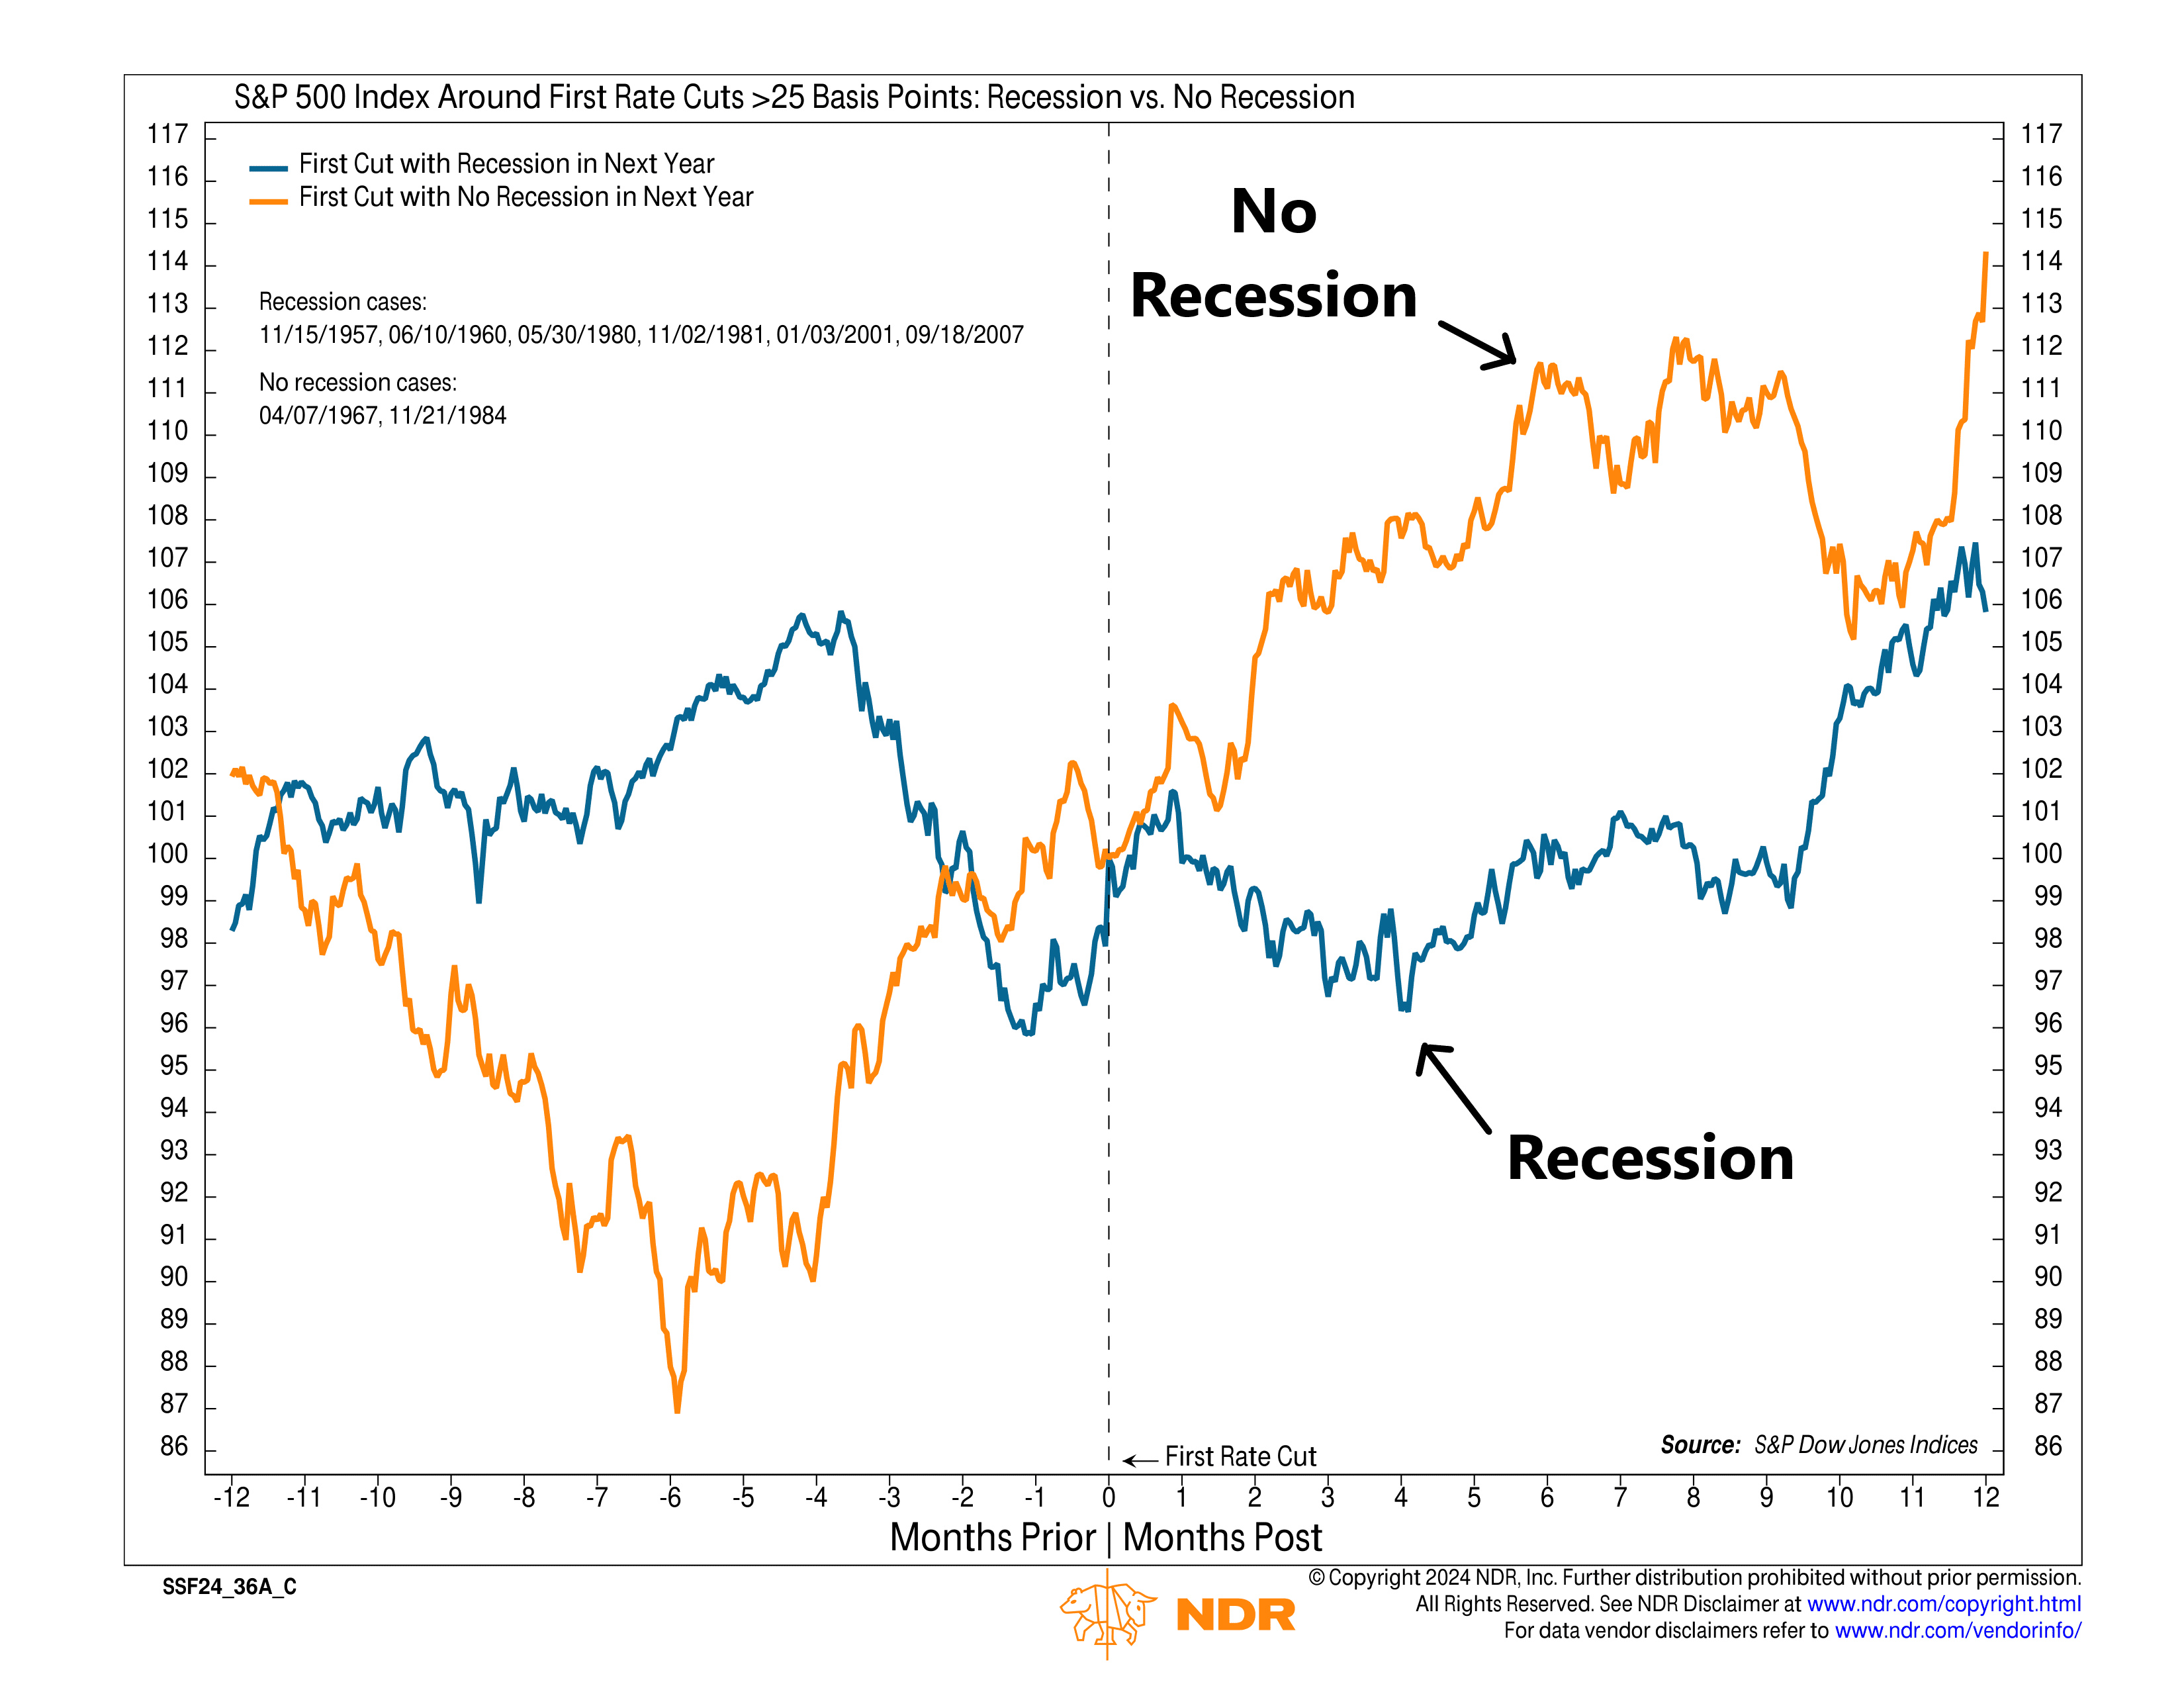
What does this mean for risk assets? It’s hard to say. If we look at the historical record, we see there have been eight other times the Fed has cut rates by more than 25 basis points for their first rate cut. And as the chart below shows, only two occurred outside of a recession.

In simple terms, if we avoid a recession, this larger rate cut could be bullish for stocks. But if a recession does hit, we could see some turbulence ahead.
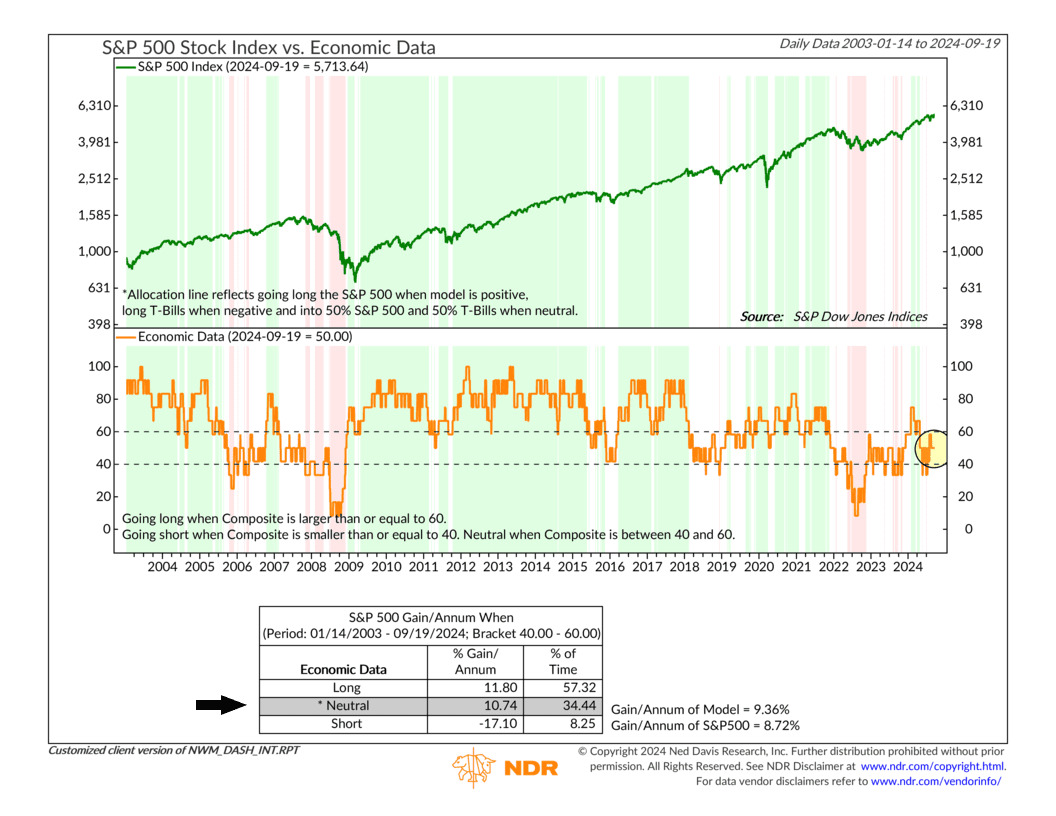
For now, the economy is holding steady. Our Economic Data model, shown below, sits right in the neutral zone, suggesting current conditions are neither particularly supportive nor harmful to the stock market.

Moving forward, we’ll want to see continued strength in the data to help sustain the bull market. Key indicators like credit spreads, financial liquidity, corporate earnings, and inflation will be critical in determining the market’s direction. If these metrics hold up or improve, it could give the market the boost it needs to rally further.
However, any significant deterioration in these areas could shift sentiment quickly and lead to increased volatility. In this environment, investors should stay vigilant and be prepared for potential shifts, as the path ahead could take some unexpected turns.
This is intended for informational purposes only and should not be used as the primary basis for an investment decision. Consult an advisor for your personal situation.
Indices mentioned are unmanaged, do not incur fees, and cannot be invested into directly.
Past performance does not guarantee future results.
The S&P 500 Index, or Standard & Poor’s 500 Index, is a market-capitalization-weighted index of 500 leading publicly traded companies in the U.S.
