OVERVIEW
Markets had a solid week, with most major indexes in the green. The S&P 500 climbed 1.47%, while the Dow added a more modest 0.55%. Tech stocks led the way, pushing the Nasdaq up 2.58%.
Small-cap stocks didn’t get the same love, with the S&P 600 slipping 0.10% and mid-caps (S&P 400) down 0.25%. Broader market performance was strong, though, with the Russell 3000 gaining 1.33%, and its growth-focused counterpart tacking on 1.93%.
Overseas, markets had a great week. Developed international stocks (EAFE) popped 2.61%, and emerging markets climbed 1.51%. Meanwhile, the U.S. dollar fell 1.05%, giving foreign assets a boost.
Bonds were mostly steady. Long-term Treasuries ticked down 0.15%, but short- and intermediate-term Treasuries managed small gains. Investment-grade bonds rose 0.35%, while high-yield bonds inched up 0.26%.
Commodities were all over the place. Broad commodities added 1.59%, but oil barely moved, slipping 0.05%. Gold edged up 0.45%, while corn was the week’s standout, jumping 3.81%.
Volatility took a nosedive, with the VIX dropping 10.70%, signaling a calmer market.
KEY CONSIDERATIONS
Red Light, Green Light – You know that childhood game Red Light, Green Light? One second, you’re sprinting forward. The next, you slam on the brakes, trying not to topple over. The stock market kind of works the same way. Sometimes, it’s full speed ahead. Other times, it’s a sudden stop. And every now and then, you’re stuck in between, waiting for the next move.
Right now, that’s exactly where we are—some signals flashing green, others screaming red, and a whole lot of yellow in between.
For example, our first chart looks at global markets (ACWI) and whether companies expect future earnings to grow faster than past earnings. Right now, 67% of markets are in the future-earnings-growing-faster category—historically a good sign for stocks. That’s a green light.
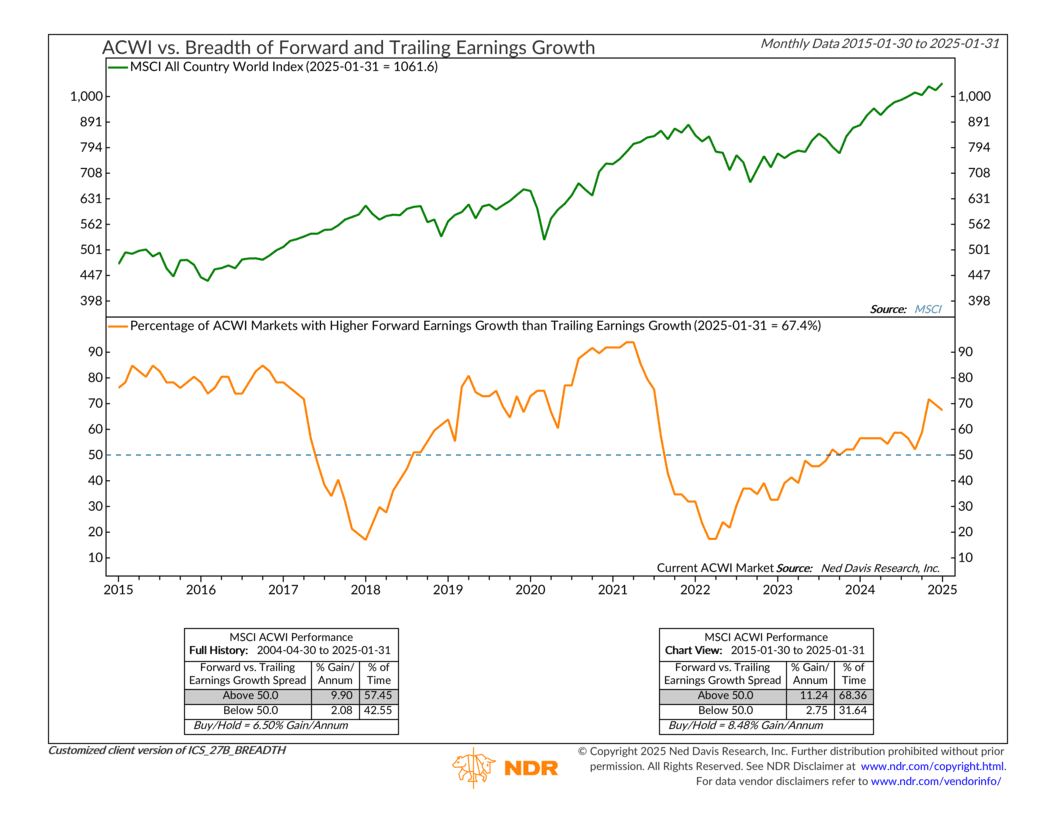
But here’s the thing: while this indicator has been climbing, it’s not in full-throttle territory like we’ve seen in previous years. It’s more of a cautious green—not an all-clear, but a step in the right direction.
Still, the broader market isn’t just about earnings expectations. What investors actually do with their money tells us just as much, if not more, about where things are headed. And that brings us to the next key signal—how many stocks are actually pushing to new highs versus breaking down to new lows.
This second chart tells the story. It tracks how many stocks are hitting new 52-week highs (green) versus those setting new lows (red). And the last few months have played out like a classic case of stop-and-go.
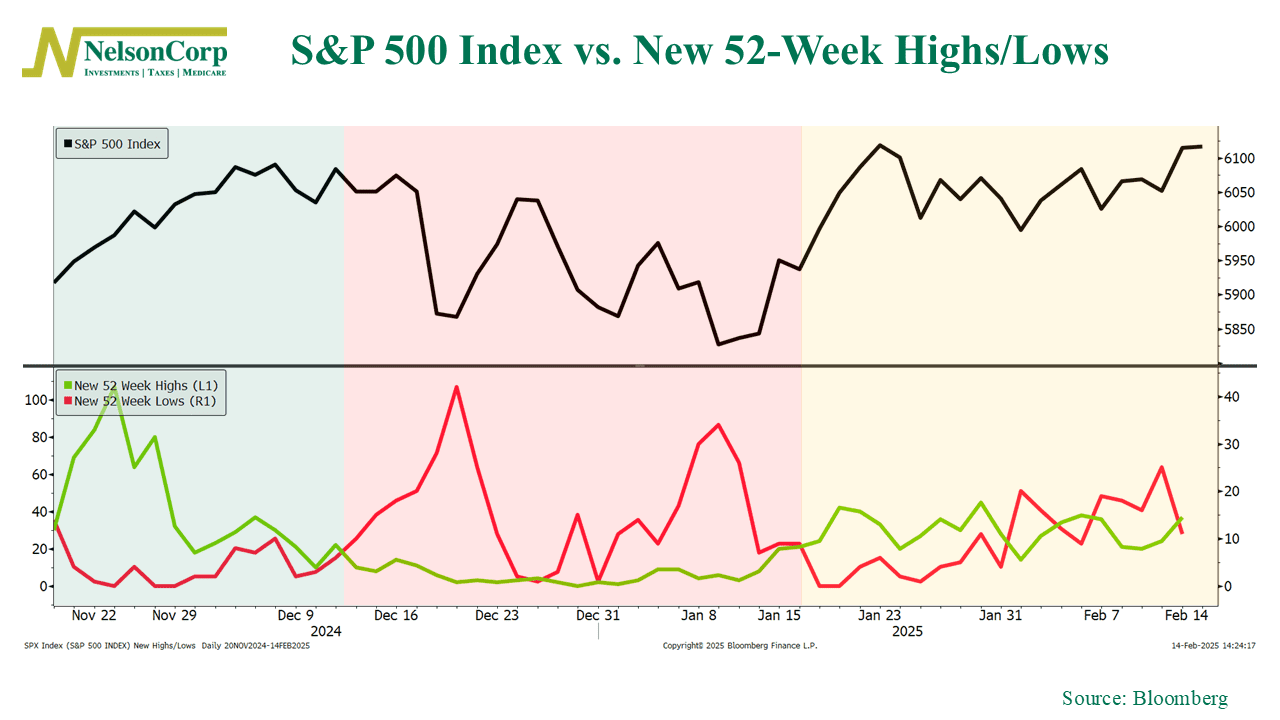
Back in November, it was all green lights. Stocks were making fresh highs, the market was moving up, and optimism was easy to find.
Then came December, and the mood flipped fast. The red line spiked as more stocks started breaking down. Instead of new highs leading the way, new lows took control. It was a stumble.
But now? We’re in a yellow zone. New highs and new lows are tangled up, neither really in charge. Some stocks are still finding their footing, while others are struggling to gain traction. It’s the kind of setup that keeps investors guessing—are we about to get the green light again or is another red light just around the corner?
So, what do you do when the light is yellow? You slow down, stay alert, and get ready for the next change. The market isn’t screaming “stop,” but it’s not saying “go” either.
That means being patient. Avoid chasing momentum just because it looks like the market might be taking off. At the same time, don’t assume a red light is coming just because December was rough.
In Red Light, Green Light, the ones who win aren’t the ones who move first—they’re the ones who move at the right time.
This is intended for informational purposes only and should not be used as the primary basis for an investment decision. Consult an advisor for your personal situation.
Indices mentioned are unmanaged, do not incur fees, and cannot be invested into directly.
Past performance does not guarantee future results.
The S&P 500 Index, or Standard & Poor’s 500 Index, is a market-capitalization-weighted index of 500 leading publicly traded companies in the U.S.