OVERVIEW
The U.S. stock market faced a challenging week, with all three major indices closing in negative territory. The S&P 500 fell 1.99%, the Nasdaq dropped 1.78%, and the Dow slid 2.25%. Small-cap stocks fared the worst, tumbling nearly 4.8% for the week.
International markets didn’t perform much better. Developed markets declined 3.6% while emerging markets slid 3.14%. A 0.79% rise in the U.S. dollar added pressure to foreign assets.
Bonds also struggled, as the 10-year Treasury yield edged up to 4.5% from 4.4%, driving U.S. bond prices down about 1%.
Real estate had a rough week, falling 4.8%, while commodities posted smaller losses. Oil dropped 1.5%, gold slipped 1.15%, and corn bucked the trend, rising roughly 1%.
KEY CONSIDERATIONS
Soaring Sentiment–but Who’s Pulling the Sled? – With the holidays in full swing, I thought now would be a great time to check in on investor sentiment and see just how optimistic—or cheerful—investors have been this year.
The American Association of Individual Investors publishes a great weekly survey measuring the level of bullish and bearish sentiment in the market. The chart below captures this spread over the past three years.
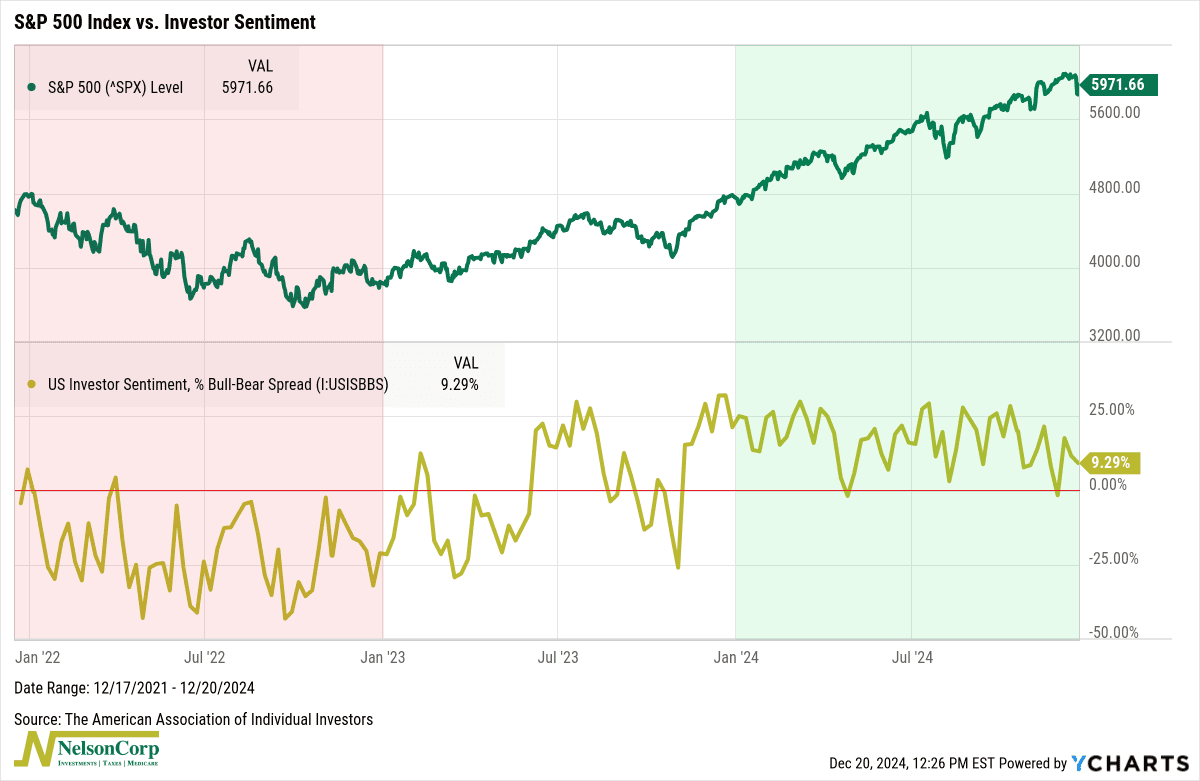
A few interesting things stand out, which I’ve highlighted. In 2022, investor sentiment was downright gloomy, with bearish sentiment far outweighing bullish views (as reflected in the negative readings). Unsurprisingly, the S&P 500 (green line, top chart) had a rough year, weighed down by the heavy cloud of pessimism.
In 2023, the market reacted a bit more normally to sentiment. Sentiment swung back and forth from bullish to bearish, and the market behaved in classic contrarian fashion—spikes in optimism led to market pullbacks, while dips in sentiment sparked rallies.
This year, however, has been a different story altogether. Investor optimism has remained persistently high, and the market has responded with consistent gains. In a way, it’s as if the holiday cheer has been in full swing all year long, keeping the S&P 500 firmly in the green.
But here’s where the story takes a turn. Our Participation Composite, shown below, has quietly hit its lowest level of the year. Translation? Fewer and fewer stocks are contributing to the rally. This narrowing participation raises questions about how long the market can keep climbing.
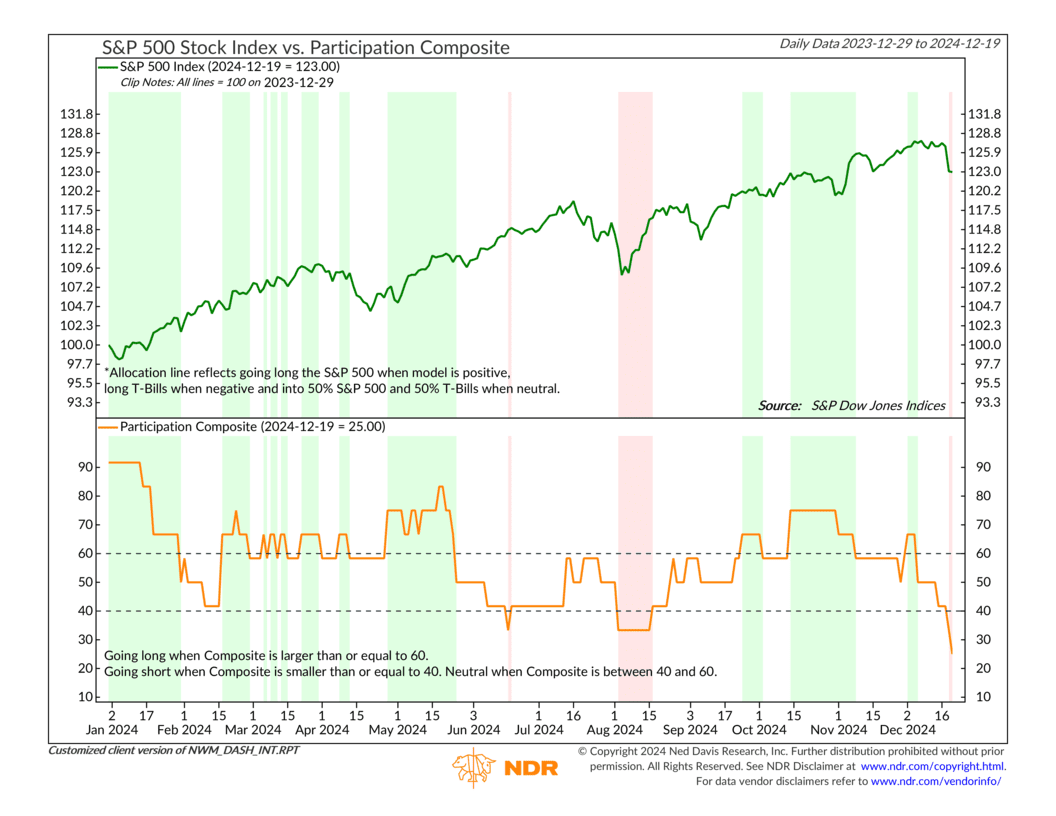
It’s a bit like Santa’s sleigh, with only a few reindeer pulling the load. Sure, it’s still moving forward, but how sustainable is it without the whole team? Historically, narrow participation has often been a warning sign for the market.
So, while sentiment may be shining brightly like holiday lights, the weak participation is a reminder to stay cautious. After all, even the most dazzling tree needs a sturdy base—or it’s just one nudge away from toppling over.
This is intended for informational purposes only and should not be used as the primary basis for an investment decision. Consult an advisor for your personal situation.
Indices mentioned are unmanaged, do not incur fees, and cannot be invested into directly.
Past performance does not guarantee future results.
The S&P 500 Index, or Standard & Poor’s 500 Index, is a market-capitalization-weighted index of 500 leading publicly traded companies in the U.S.