OVERVIEW
The U.S. stock market registered its fourth weekly gain last week. The S&P 500—an index of the 500 largest stocks in the United States—rose 3.26%. The Dow Jones Industrial Average gained 2.92%, and the Nasdaq Composite increased 3.08%.
The biggest gains were centered around value stocks, as the Russell 3000 Value Index surged 4.01%. Growth stocks still had a good week, however, as the Russell 3000 Growth Index gained 3%.
Foreign stocks were up on the week, although they lagged U.S. stocks. The MSCI EAFE Index of developed country stocks rose 2.07%, and the MSCI EM Index of emerging market stocks increased 1.39%.
Bonds were mostly mixed for the week. Long-term Treasury prices fell 1.13%, whereas short-term Treasuries gained about 0.07%. The yield curve remained inverted, with 2-year Treasury rates exceeding 10-year rates by roughly 40 basis points.
Both real estate and commodities had strong weekly rallies alongside the stock market. Real estate gained 4.51%, and commodities rose 4.54%. Oil was up 4.81%, gold rose 1.36%, and corn prices increased 5.25%. Helping commodities was a weaker dollar, which fell about 0.88% relative to the world’s major currencies.
KEY CONSIDERATIONS
Sometimes It Rhymes – This week’s much-anticipated event was the Bureau of Labor Statistics’ monthly release of the Consumer Price Index (CPI).
It didn’t disappoint.
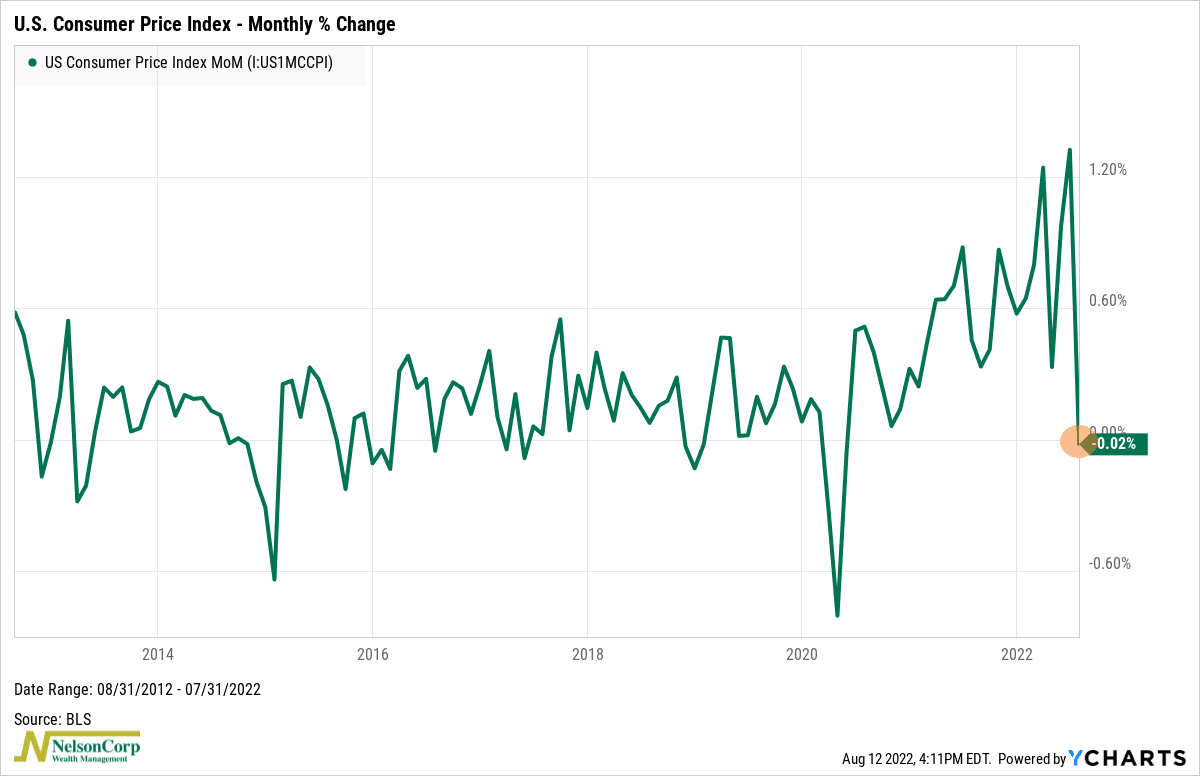
As shown on the graph below, the CPI—which represents the prices of a basket of goods and services consumed by the average urban American—was essentially flat in July.

This was significant because the CPI had been increasing every month since June 2020.
To be sure, one month does not a trend make. But it is a step in the right direction, and investors have cheered the prospect of a possible peak in inflation as stocks have rallied strongly from the mid-June lows.
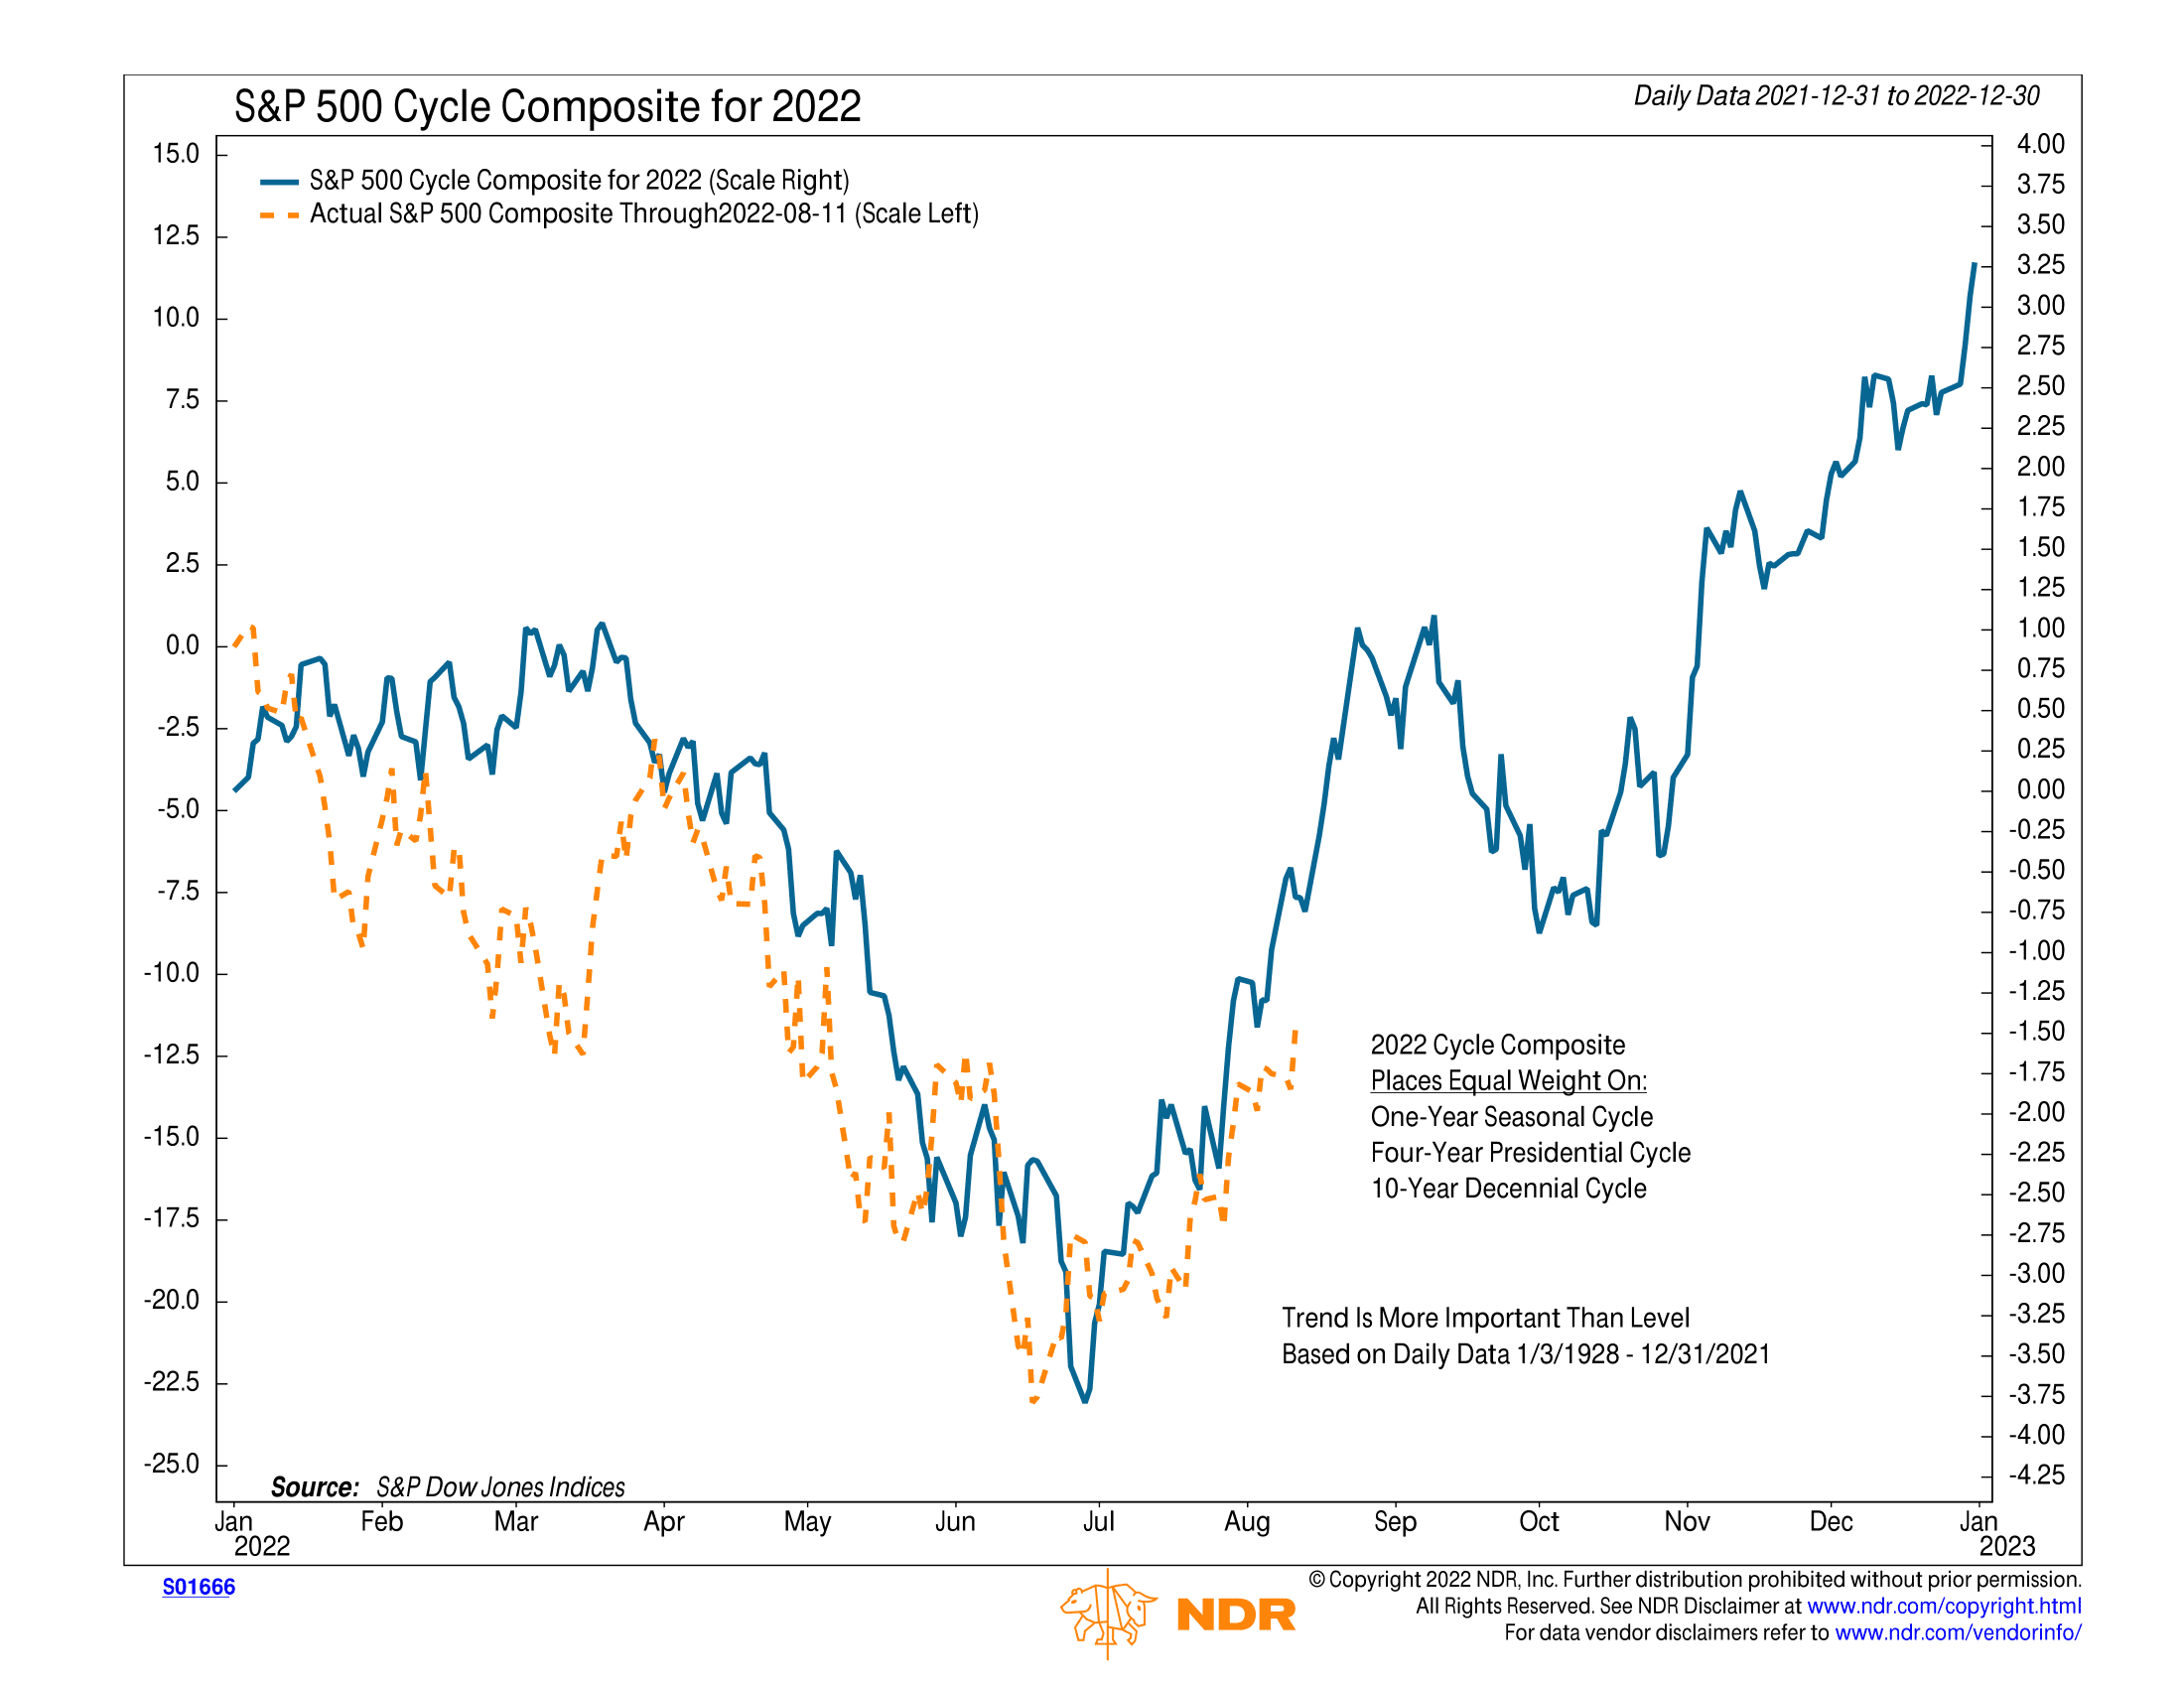
Speaking of the mid-June lows, here’s a fun chart that I’ve been watching. This is the Ned Davis Research S&P 500 Cycle Composite for 2022. It’s designed to show how repetitive historical patterns can indicate a potential pattern for the current year.

As you can see, it anticipated that the S&P 500 would likely bottom out this summer and rally higher—and that’s exactly what the S&P 500 has done. In fact, the S&P 500 has been tracking the cycle composite rather closely all year.
Looking ahead, according to the cycle composite, we should expect the rally to continue into the Fall, at which point we would see a pullback before another year-end rally after the mid-term elections.
Now, to be sure, this is not a specific input we use to manage risk, and we don’t recommend relying on seasonal or cyclical patterns like this one as a market timing tool. But, knowing the historical tendencies of the stock market can help provide perspective and add context to the current environment. As they say, history doesn’t repeat itself, but sometimes it does rhyme.
Turning to the current price action of the stock market, it’s clear that momentum has shifted to a more positive tone. After last week’s gain, the S&P 500 has recovered more than 50% of its decline since the slide started on January 4th.
Why is this important? Because in nearly every bear market in the past, rarely have stocks ever exceeded the 50% retracement level unless the final low had been made.
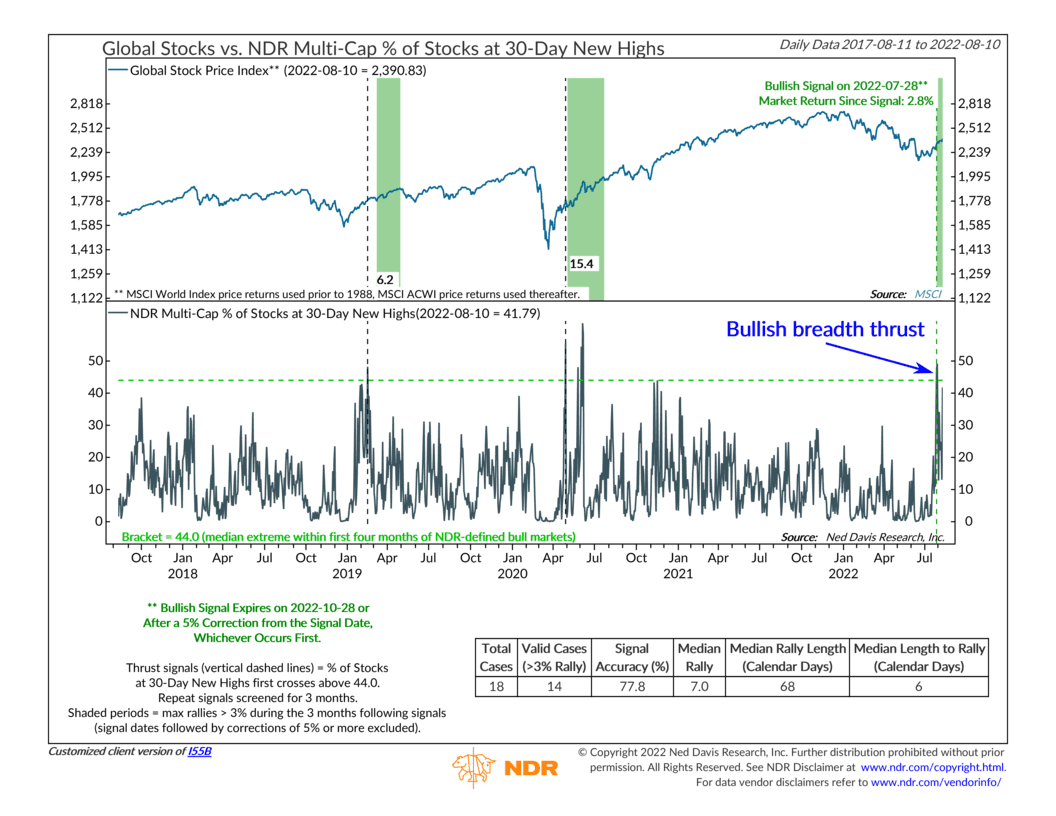
There’s also evidence that the recent rally has been fairly broad-based as well. As the chart below shows, nearly 50% of stocks have traded at 30-day new highs recently. This is the type of price action we tend to see before strong market rallies.

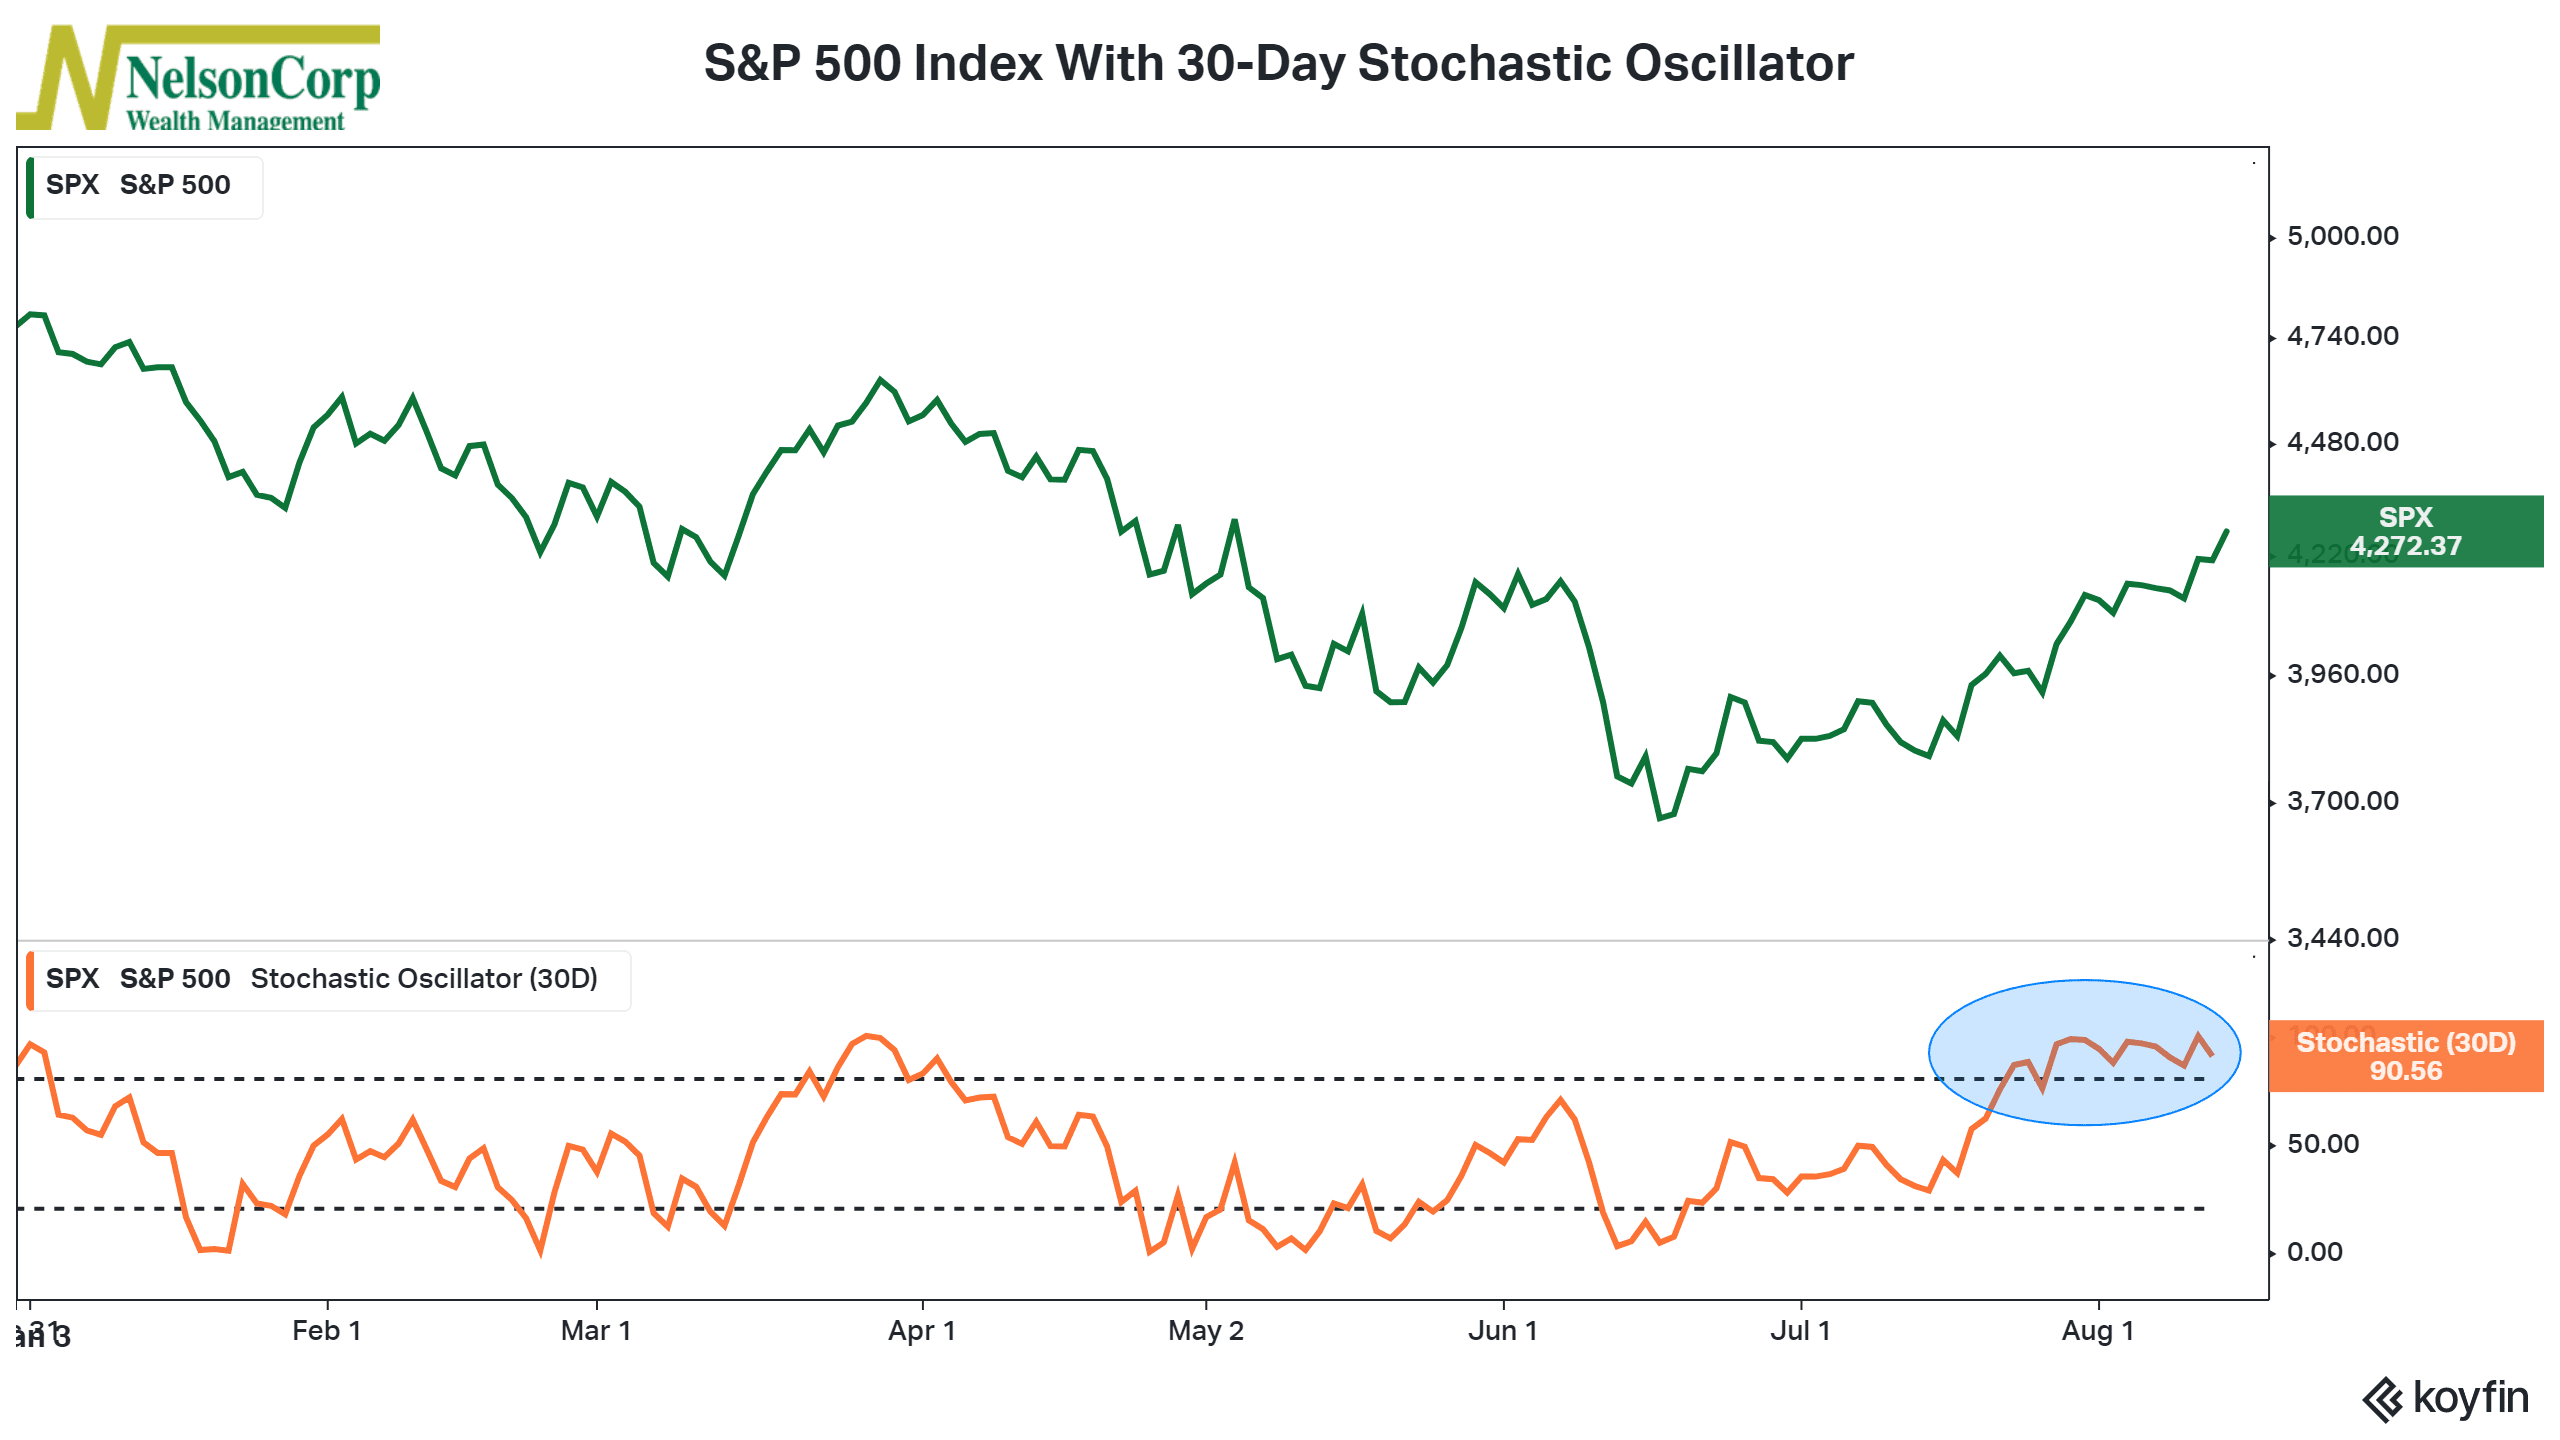
But not everything is positive at the moment. Sentiment remains elevated, which is a negative from a contrarian point of view, and there are some signs that the market is looking overbought after the recent rally.
For example, the 30-day Stochastic Oscillator, shown on the chart below, is in an overbought (negative) zone.

This has the potential to weigh on the market if we see breadth deteriorate from here.
So, overall, there are reasons to believe the market could continue to move higher from here, particularly given the message from the cycle composite. However, headwinds remain for the market, and the idea that we could see another pullback is not necessarily out of the question.
This is intended for informational purposes only and should not be used as the primary basis for an investment decision. Consult an advisor for your personal situation.
Indices mentioned are unmanaged, do not incur fees, and cannot be invested into directly.
Past performance does not guarantee future results.
