OVERVIEW
U.S. stocks had a choppy week that saw the S&P 500 fall 1.22%, the Dow drop 0.91%, and the Nasdaq decline 2.62%. Growth stocks saw the most selling, down 2.29% on the week, whereas value stocks fell 1.22%.
International stocks were mixed. The MSCI EAFE index of developed country stocks fell 0.97%, and the MSCI Emerging Markets index notched a modest gain of 0.12%.
The 10-year Treasury yield fell to 1.36% from 1.5% the prior week. Long-term Treasuries rallied 5.82% in response. Investment-grade bonds also rose 0.86%, high-yield (junk) bonds gained 0.63%, municipal bonds increased 0.04%, and TIPS lost about 0.09%.
Commodities had a rough week, falling 4.3%. Oil was down 3.28%, gold dropped 0.23%, and corn declined 1.31%. The U.S. dollar was roughly flat to end the week.
KEY CONSIDERATIONS
Stocks Look Oversold, but Breadth Is Still a Concern – U.S. stocks hit a bit of a rough patch last week, as the S&P 500 stock index ended the week around 3.5% below its all-time high. That might not seem like much of a drop—and it wasn’t—but it was accompanied by a lot of volatility, which can make the selling feel more intense at times. Nonetheless, the thing that investors mostly care about is whether we’ll continue to see more selling before the year is up.
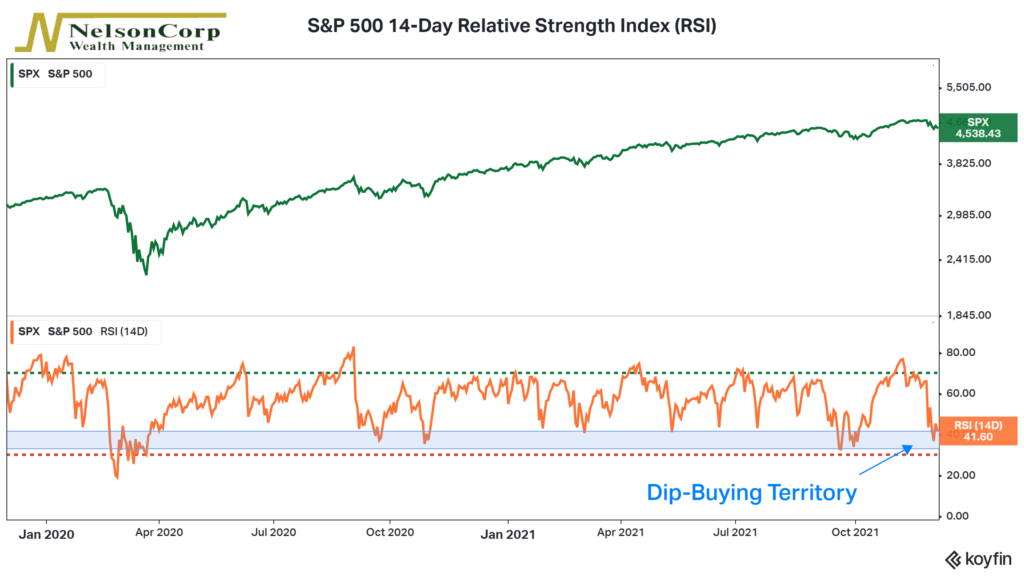
The technical indicator below might provide some clues. It’s called the 14-Day Relative Strength Index (RSI), and it looks at price changes of the S&P 500 stock index over the past 14 days to determine if the stock market’s price action looks overbought or oversold.

Generally, readings below 30 (the red dashed line) have historically represented oversold conditions. The reading as of last Friday was near 40. Based on the general rule of the indicator, then, the selling might not be over. Perhaps we have more room to fall before we get to truly oversold levels.
With that said, however, you can also see that the RSI got to a reading of just under 40 in the last couple of selloffs. At these levels, the dip was bought, and the market reversed course before the RSI ever fell below 30 (oversold territory). Therefore, if this year’s price action is any guide, the market might be oversold enough already for investors to rush in and buy the dip.
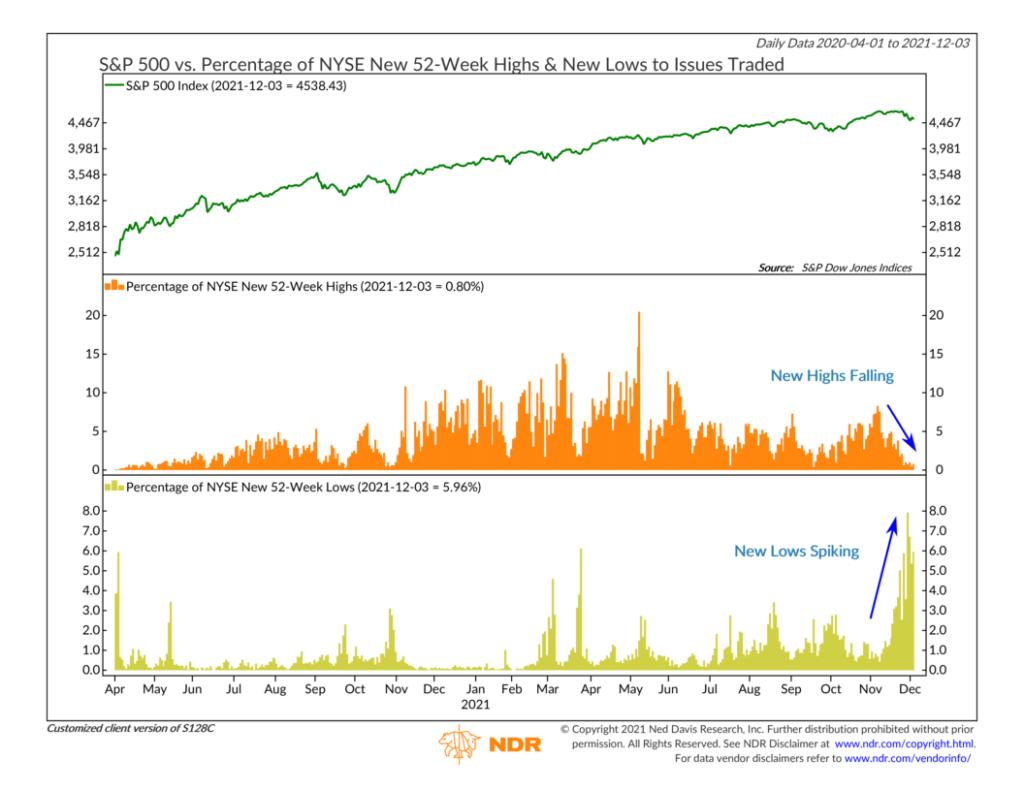
However, there is one area of concern, and that’s breadth. We’ve seen the number of stocks hitting new 52-week highs decline steadily since the beginning of November, and the number of stocks reaching new 52-week lows has climbed considerably. You can see this on the chart below.

It’s a bit concerning because more and more stocks are breaking down and exhibiting weakness under the surface. That could spell trouble for the broader stock market.
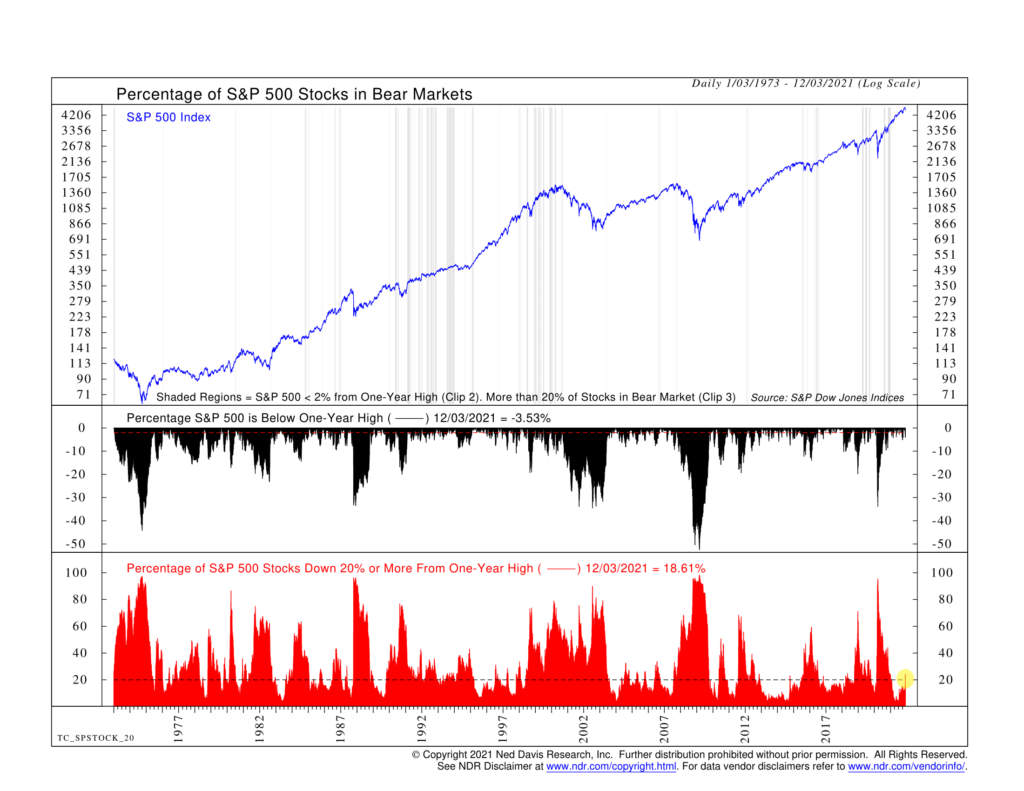
More so, this next chart shows that the percentage of stocks in the S&P 500 stock index that are down 20% or more from a one-year high recently rose above 20% for the first time since the March 2020 selloff. At this point, that’s not too worrisome, but it is something to keep an eye on as it could be a sign of more breadth deterioration to come.

So, overall, we’d say that the market is probably leaning more oversold in the short term, with investors perhaps eager to buy into another dip before the year is up. But, at the same time, there are also some yellow flags out there concerning breadth that are definitely worth watching.
This is intended for informational purposes only and should not be used as the primary basis for an investment decision. Consult an advisor for your personal situation.
Indices mentioned are unmanaged, do not incur fees, and cannot be invested into directly.
Past performance does not guarantee future results.
