OVERVIEW
U.S. stocks posted modest gains last week, with the S&P 500 up 0.22%, the Dow adding 0.09%, and the Nasdaq rising 0.10%. However, small caps lagged, dropping around 0.75%.
International markets were mixed—emerging markets gained 0.41%, while developed markets took a sharp hit, falling 3.74%. The U.S. dollar had a strong week, climbing over 2%.
Bonds struggled as the 10-year Treasury yield jumped from 3.75% to 3.96%, pushing the overall bond market down around 1.5%.
Real assets showed mixed results, with real estate slipping 1.6% while commodities gained 1.8%. Oil surged 8.65%, gold stayed mostly flat, and corn edged up 1.6%.
KEY CONSIDERATIONS
Take a Chance on Me – It’s been a bumpy ride for U.S. stock investors over the past few months. But lately, the market seems to be channeling its inner ABBA, singing out to investors, “Take a chance on me!”
Take a look at the chart below, featuring the 200-day Risk-On/Risk-Off Diffusion Index. Without getting too deep into the technical weeds, this indicator tracks a group of financial indices tied to rising markets (Risk On) and subtracts those tied to falling markets (Risk Off). The result is the Diffusion Index—represented by the orange line on the chart.
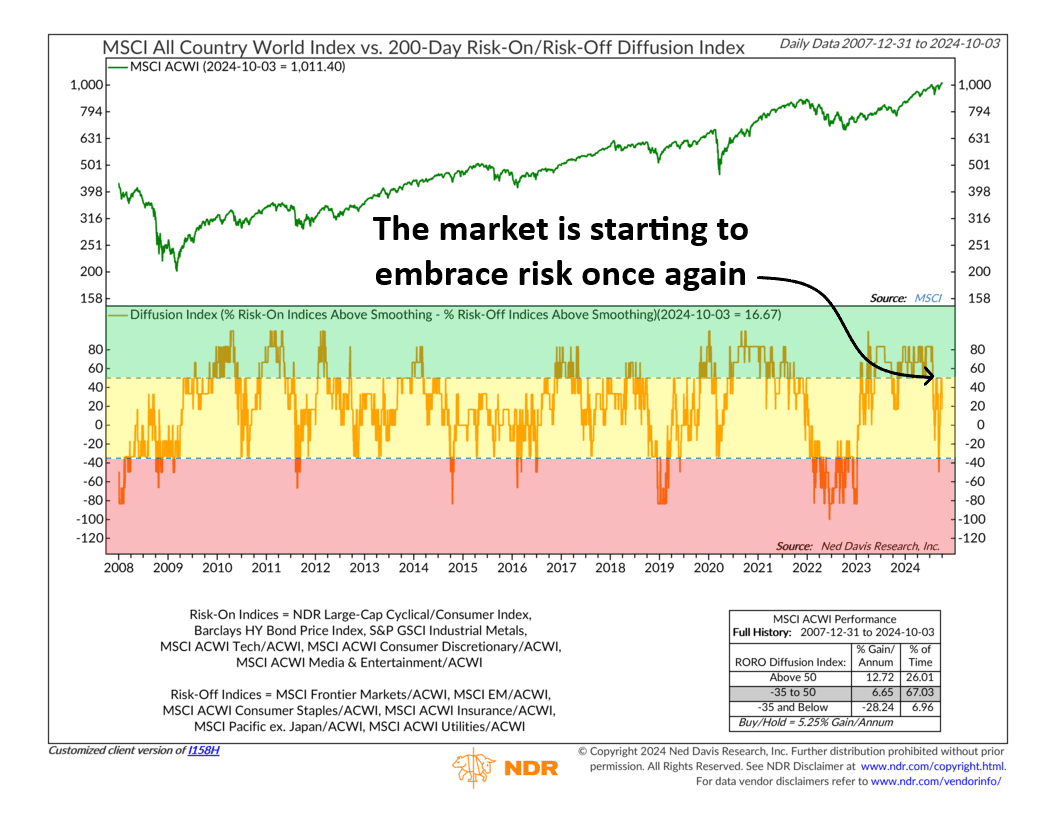
When the index is trending upwards, and especially when it’s above 50 (the green zone), it signals that Risk On indices are outperforming. Historically, this kind of environment has been very bullish for global stocks.
As you can see, the market was in Risk On mode for most of the year, until a few months ago when the switch flipped to Risk Off (red zone).
But the good news? The Diffusion Index has bounced back, is currently in the neutral (yellow zone), and inching closer to a Risk On environment once again. Great news!
Oh yeah, and then there is the underlying economic data, which is starting to surprise to the upside once again. The Citigroup Economic Surprise Index, a widely followed indicator that provides a quick-and-dirty snapshot of how the economy is faring against expectations, is back into neutral territory after being negative since June.
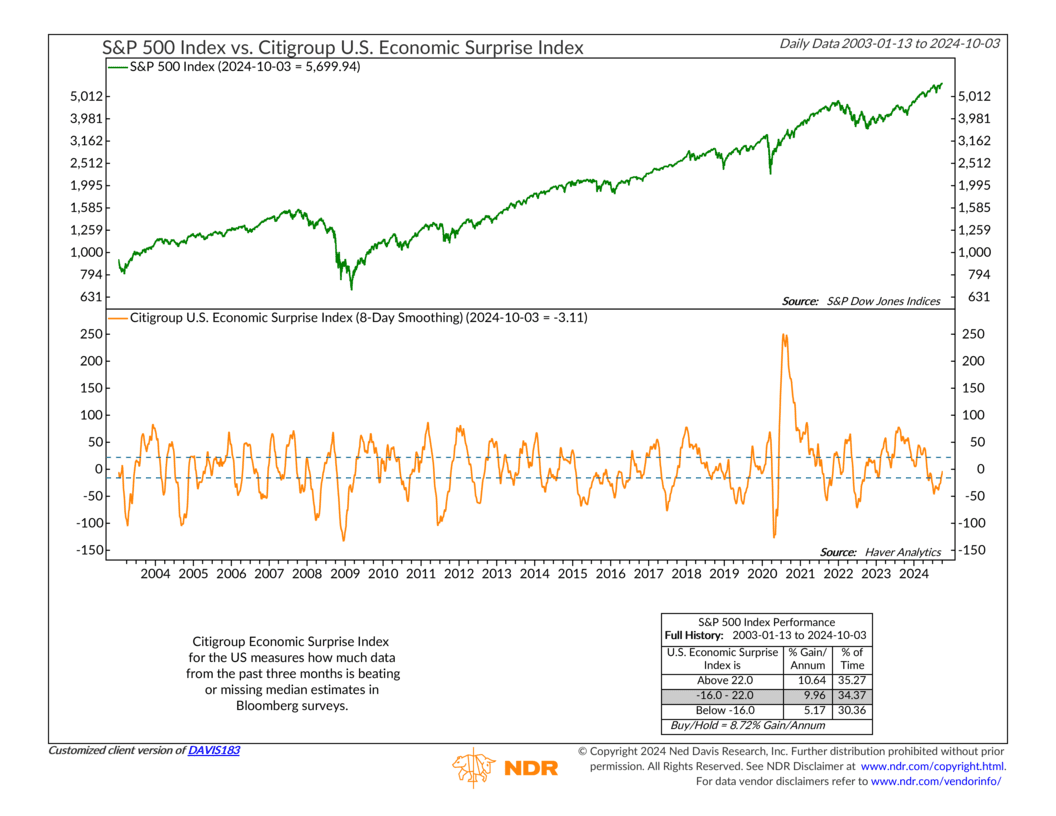
This tells us the U.S. economy is stronger than forecasts and working its way through any short-term growth scares.
Bottom line: The evidence is shifting in a more positive direction, meaning now could be a good time to start gradually re-engaging with the stock market.
This is intended for informational purposes only and should not be used as the primary basis for an investment decision. Consult an advisor for your personal situation.
Indices mentioned are unmanaged, do not incur fees, and cannot be invested into directly.
Past performance does not guarantee future results.
The S&P 500 Index, or Standard & Poor’s 500 Index, is a market-capitalization-weighted index of 500 leading publicly traded companies in the U.S.