OVERVIEW
Markets took a beating this week, with major indexes deep in the red. Volatility surged, with the VIX climbing above 24, signaling heightened market uncertainty. The S&P 500 dropped 2.97%, while the Dow Jones Industrial Average slid 2.52%. Tech stocks fared even worse, as the Nasdaq tumbled 3.90%.
Small- and mid-cap stocks were hit hard. The S&P 600 fell 4.61%, while mid-caps (S&P 400) dropped 3.81%. The broader market followed suit, with the Russell 3000 shedding 3.01%. Growth stocks continued to struggle, as the Russell 3000 Growth index plunged 3.60%.
International markets held up slightly better. Developed markets (EAFE) dipped just 0.34%, while emerging markets fell 2.62%. Meanwhile, the U.S. dollar slipped 0.48%.
Bonds remained a safe haven. Long-term Treasuries climbed 0.44%, while investment-grade bonds gained 0.18%. Short- and intermediate-term Treasuries also saw modest increases.
Commodities weren’t spared from the selloff. Broad commodities declined 1.48%, oil slipped 1.11%, and gold barely budged with a 0.06% gain. Corn, however, took a steep hit, plunging 8.65%.
KEY CONSIDERATIONS
Tension at the Trendline – The stock market had a rough week. On Thursday, the S&P 500 dropped 1.78%—its worst day of the year—knocking it down to a four-month low. But what’s really catching people’s attention is that it’s now sitting right around its 200-day moving average, something we highlighted in this week’s Chart of the Week post.
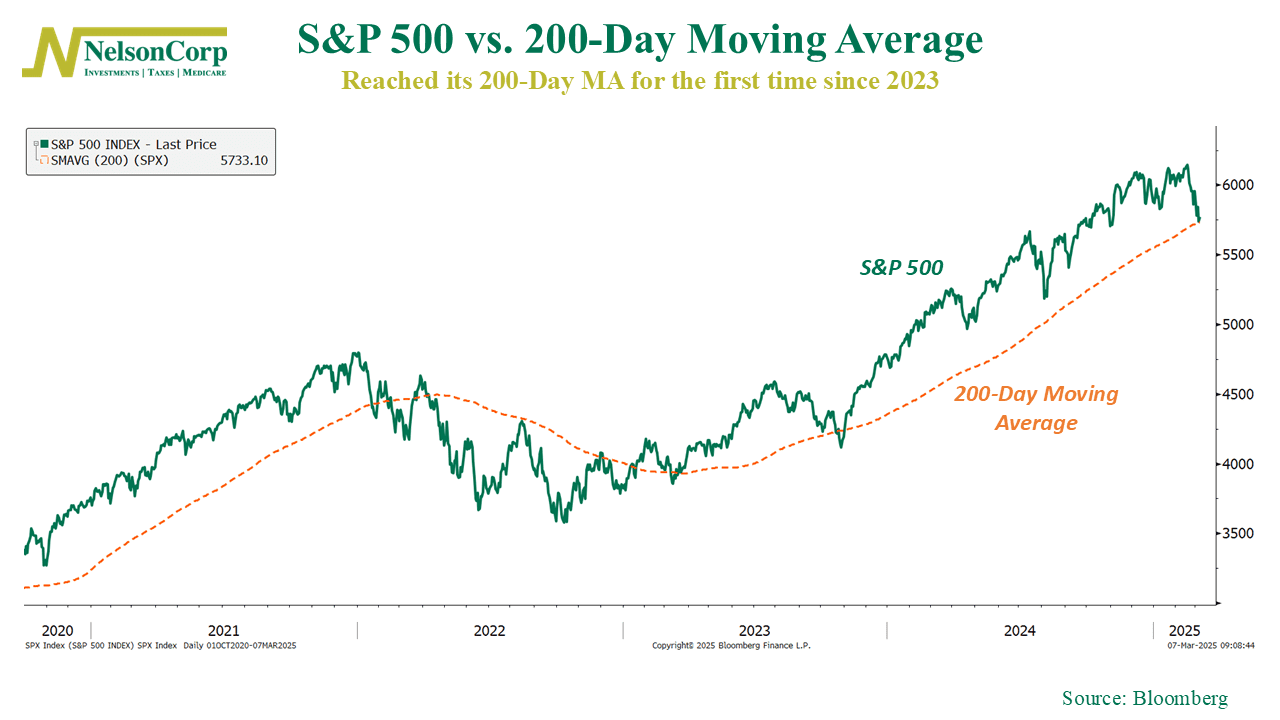
Why does that matter? Because a lot of traders watch this level like a hawk. Whether or not it should be a big deal doesn’t really matter. Enough people believe it is, which makes it an important line in the sand. And history shows that when the S&P 500 falls well below this level, it’s often a sign that more trouble is ahead.
That’s why this moment is so important. If the market keeps slipping, things could get a lot worse. So, to get a better read on where things might be headed, we’re keeping a close watch on a couple of key indicators in the trend portion of our model.
The first one is called Percentage Reversals. It’s super simple. It tracks where the S&P 500 closes each week compared to its recent high or low, then gives a buy or sell signal based on how much it moves. For example, the S&P 500 last peaked on February 14, 2025, at 6,114. A 7.2% drop from there—down to 5,674—would trigger a sell signal.
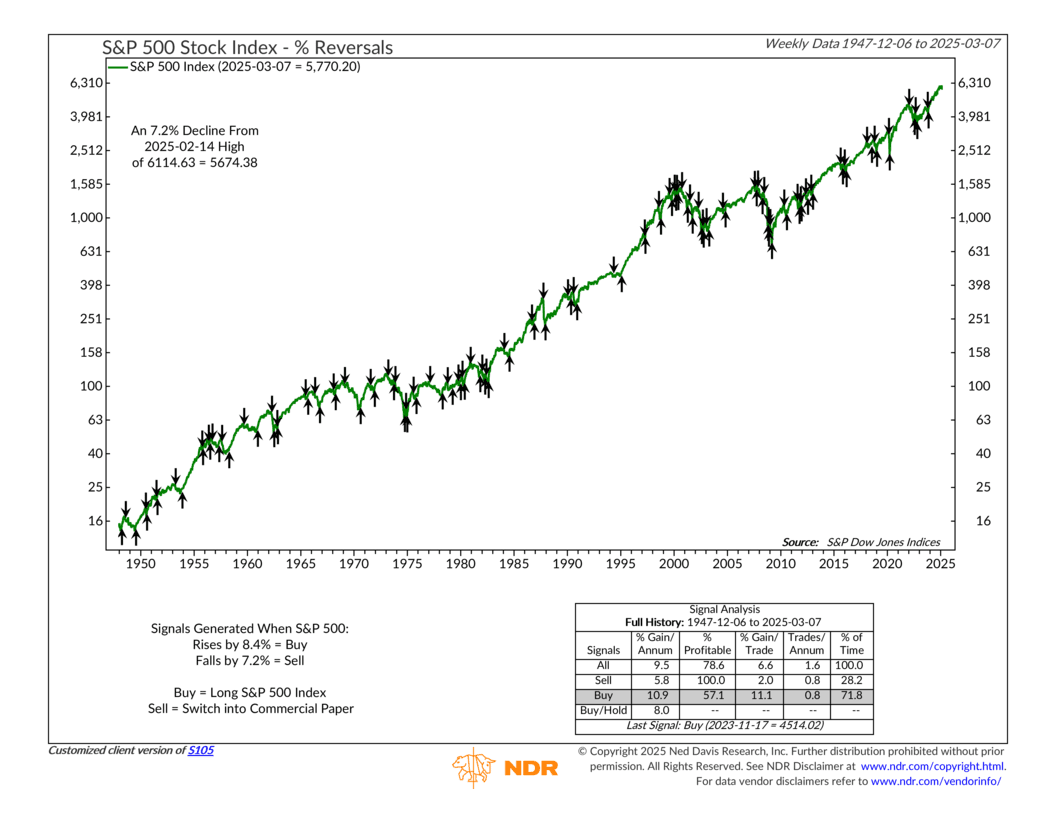
As you can see from the chart, we got close last week, but the market still has a bit to go before hitting that danger zone. A bounce here would be a good sign, but if we break through, it could mean more trouble ahead. This is definitely one to watch in the coming weeks.
The other indicator we’re watching is called Deviation from Trend Slope. This one takes a bigger-picture look at the market by comparing two moving averages—a shorter-term (63-day) and a longer-term (252-day). It creates a ratio line, and when that line moves 5% or more from a recent peak or trough, it signals a potential trend change.
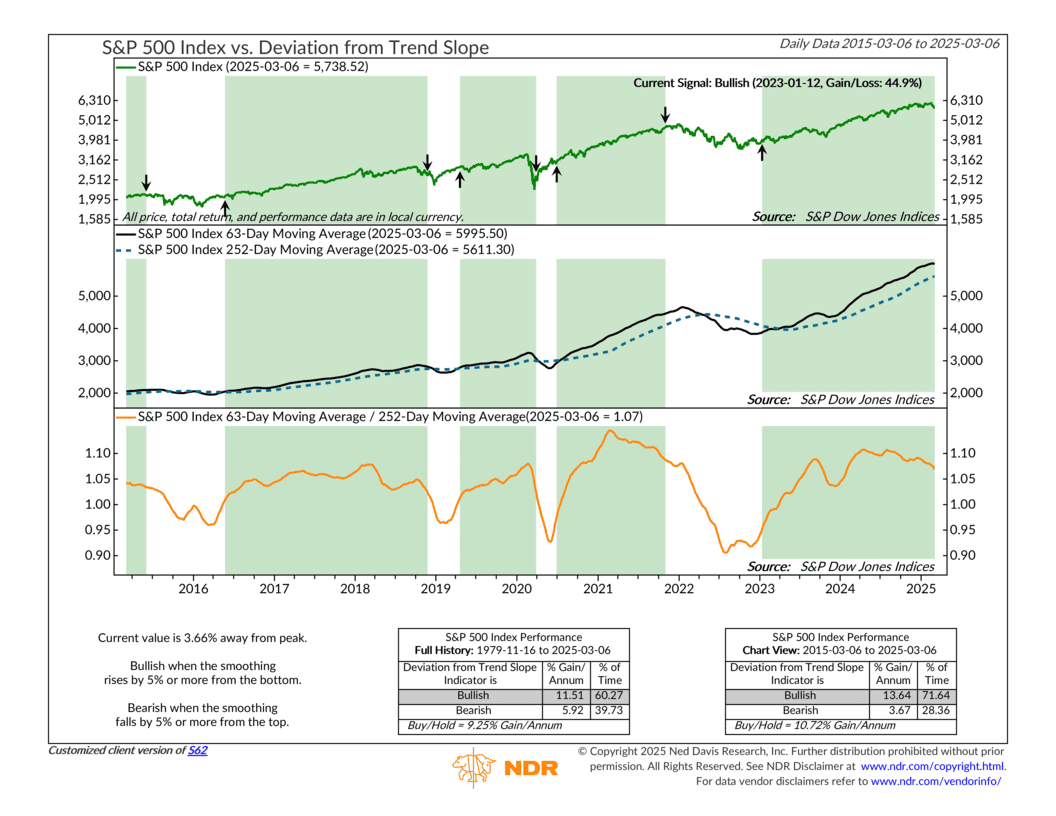
Right now, the ratio line is sitting 3.54% below its recent peak. That means the market is still technically in a bullish trend, but it’s heading in the wrong direction and creeping closer to a long-term sell signal. If it crosses that threshold, it could spell trouble for the bull market—and we’d really rather avoid that.
But, with all that said, here’s the good news. Our models have already been in “de-risk” mode for a few months now. Coming into the new year, the market environment—based on the three major areas of the market that we follow—didn’t look all that great for stocks.
So, we’ve been leaning more defensive, favoring areas of the market that hold up better when volatility picks up. And that approach has paid off.
For example, low-volatility stocks have been a bright spot so far this year. These are the slow-and-steady names that don’t swing as wildly as the broader market. While high-flying growth stocks have taken a hit, low-volatility stocks have quietly outperformed (shown below).
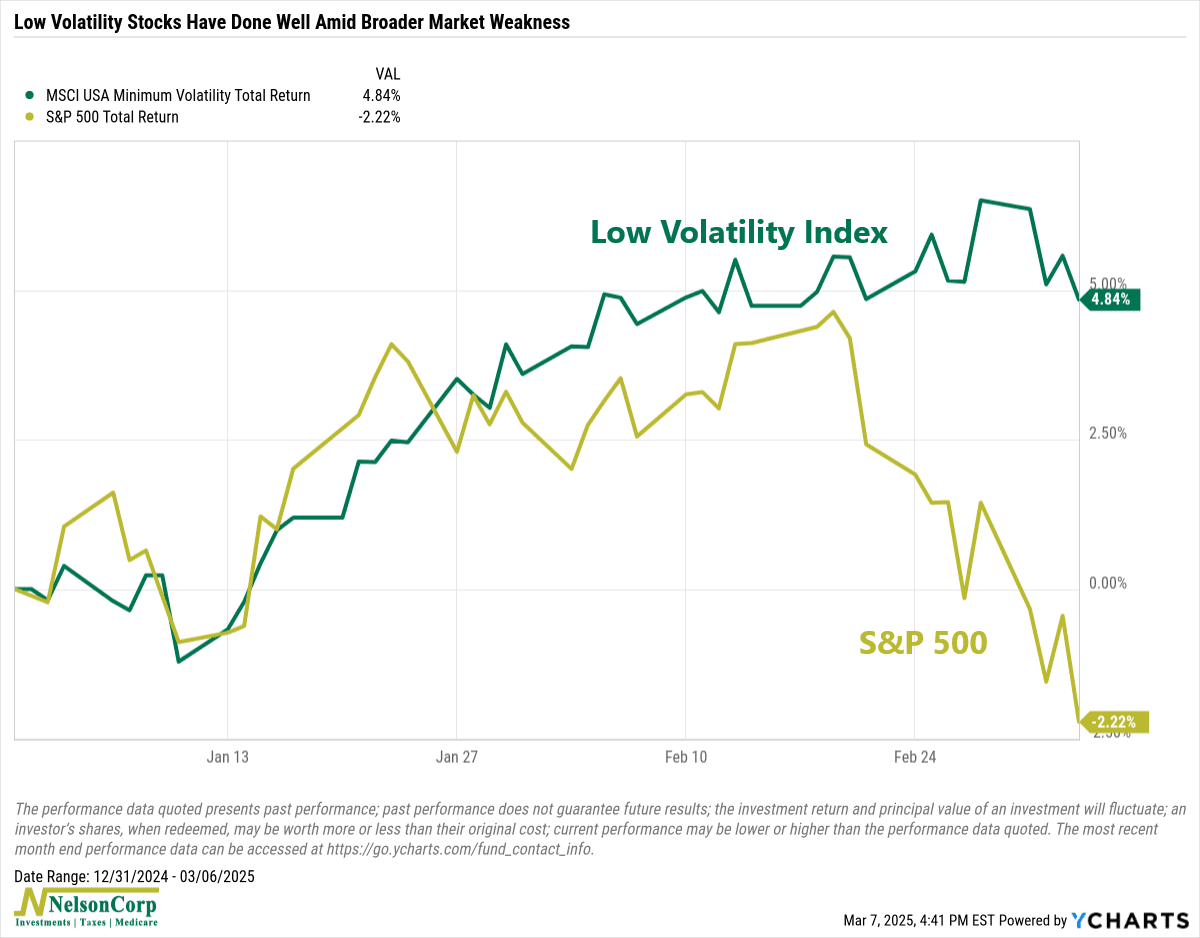
The bottom line is that staying disciplined and focusing on risk management can make all the difference.
This is intended for informational purposes only and should not be used as the primary basis for an investment decision. Consult an advisor for your personal situation.
Indices mentioned are unmanaged, do not incur fees, and cannot be invested into directly.
Past performance does not guarantee future results.
The S&P 500 Index, or Standard & Poor’s 500 Index, is a market-capitalization-weighted index of 500 leading publicly traded companies in the U.S.