OVERVIEW
The U.S. stock market rallied last week as the major indices posted gains of more than three percent.
Volatility, as measured by the VIX Index, is up relative to the start of the year, but it did pull back a bit last week as the stock market bounced off its recent decline.
International stocks also participated in the weekly rally. Emerging market stocks were up about 3.77 percent, whereas developed country stocks gained roughly 2.21 percent.
The yield on the 10-Year Treasury note settled around 1.584 percent on Friday after falling to about 1.509 percent the week before. This modest uptick in interest rates resulted in moderate price declines for most bonds.
The U.S. dollar strengthened, gaining over one percent. The firmness of the dollar continues to be a headwind for commodity prices.
KEY CONSIDERATIONS
The Most Important Prong – After a period of relative complacency, volatility is starting to come back into the market.
We are beginning to see more prominent movements not only on a closing basis but also on an intra-day basis.
As I wrote about a few weeks back, increasing volatility from a low point tends to be a sign of instability–or at least more volatility to come.
With that said, however, we must stick to our process of listening to the most important signals that jump out among the noise.
We generally use a three-pronged approach when analyzing the stock market.
Two of these prongs involve what we call external factors. They include things like investor sentiment, valuations, and economic data. These indicators do a good job of measuring the outside risks that affect the stock market over an intermediate-term time frame.
However, the most important prong is an internal one, and it is the only one that matters at the end of the day: price movement.
To paraphrase Edwin Lefevre in his classic book, Reminiscences of a Stock Operator, it doesn’t matter if you’re on the bull side or the bear side, but on the right side.
If you pay attention to what prices are actually doing, as opposed to what you think they should be doing, then you’re more likely to be on the right side.
So what’s the verdict?
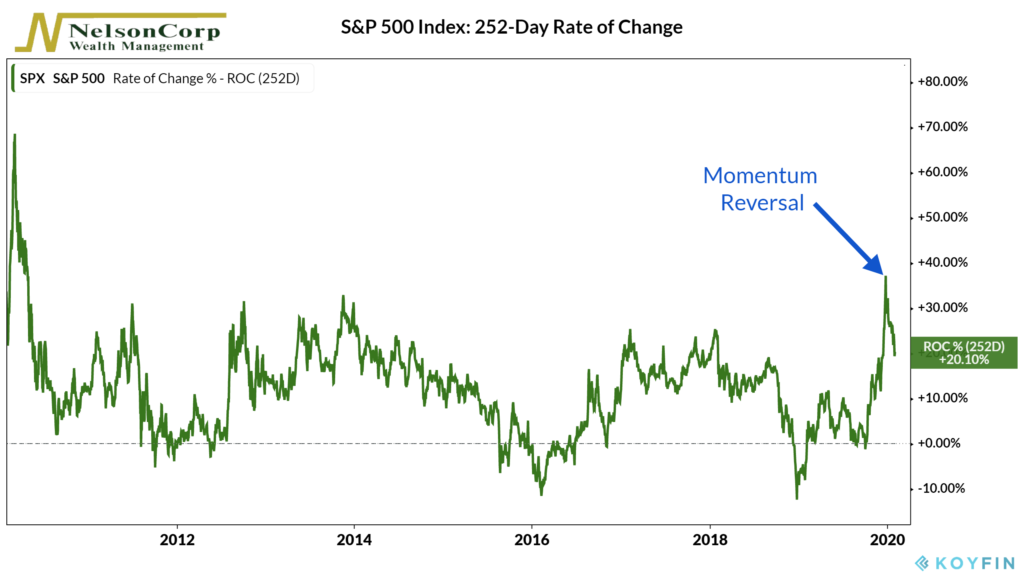
The S&P 500 has had quite the run over the past few months, but it has eased a bit in recent weeks. Momentum, in particular, has softened.
The chart below shows this visually. Specifically, it shows the rate at which the S&P 500 has been changing over the past year or 252 trading days.

The rate climbed dramatically starting in October and peaked at a level it hadn’t seen in nearly a decade.
Since then, however, the rate has been declining. We call this a “momentum reversal,” and it generally foretells lower returns going forward.
However, it’s important to note that despite declining momentum, the upward trend in stock prices remains unbroken. The average price of the S&P 500 over the past 50- and 200-days is still rising.
Of course, the market may roll over from here, but it’s too early to tell. For now, the weight of the evidence suggests it’s business as usual.
This is intended for informational purposes only and should not be used as the primary basis for an investment decision. Consult an advisor for your personal situation.
Indices mentioned are unmanaged, do not incur fees, and cannot be invested into directly.
Past performance does not guarantee future results.
