OVERVIEW
As measured by the S&P 500 index, the U.S. stock market rose 4.91 percent last week, its third straight week of gains.
Every S&P 500 sector was up, with industrials surging about 10.5 percent.
Small-cap and value stocks had their day in the sun, gaining roughly 12 percent and 7.8 percent.
International stocks did even better, with both developed country stocks and emerging market stocks gaining over seven percent.
High-yield bonds had another good week, rising 3.1 percent.
On the other hand, U.S. government debt had a rough week as the 10-year Treasury yield shot up roughly 25 basis points, ending the week around 0.9 percent.
Higher oil and grain prices helped boost commodity returns for the week.
The U.S. dollar fell more than one percent.
KEY CONSIDERATIONS
The Stampeding Bull – The stock market forged ahead and posted another strong week of gains last week. In fact, the price action of the S&P 500 has gotten increasingly bullish over the past couple of weeks, and a variety of the indicators that we track have signaled as much.
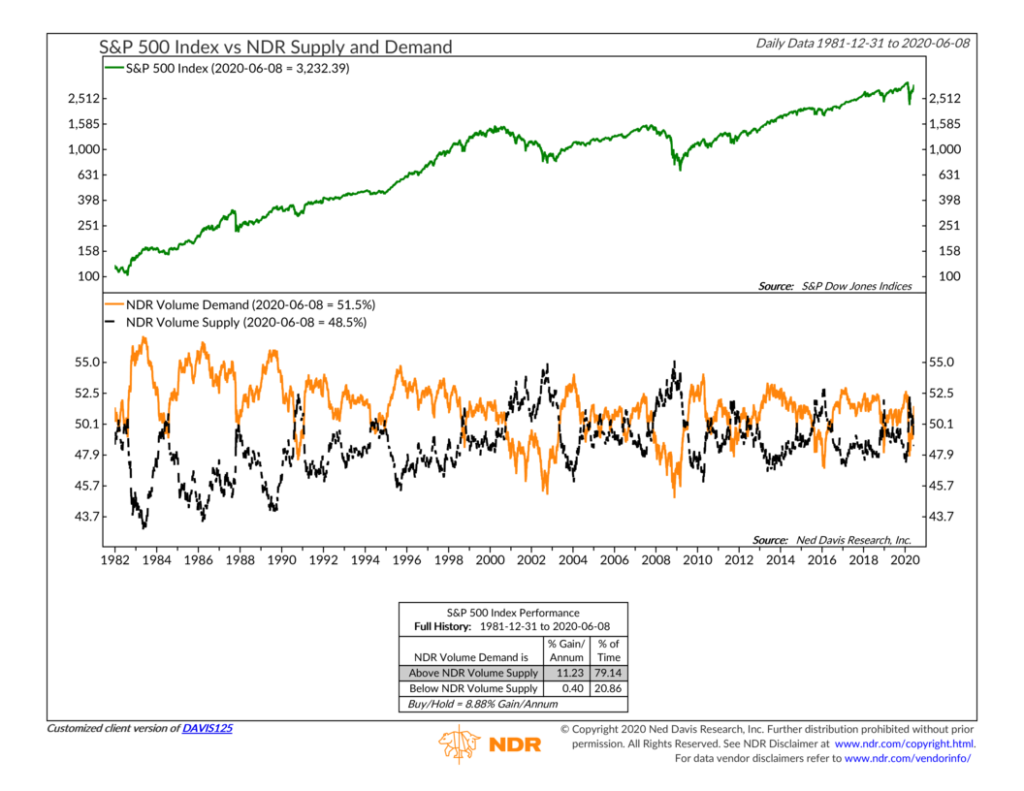
Take, for example, the trading volume in stocks that are advancing in price relative to the trading volume in stocks that are declining in price. We could say that advancing volume is like a source of demand and that declining volume is a source of supply. As every student of Econ 101 knows, demand that exceeds supply pushes prices higher, and that is what we tend to see in the stock market as well.

Last week, the volume in advancing stocks took off relative to declining volume. This shift in volume demand is another sign of the market accelerating to the upside, and stock gains tend to follow.
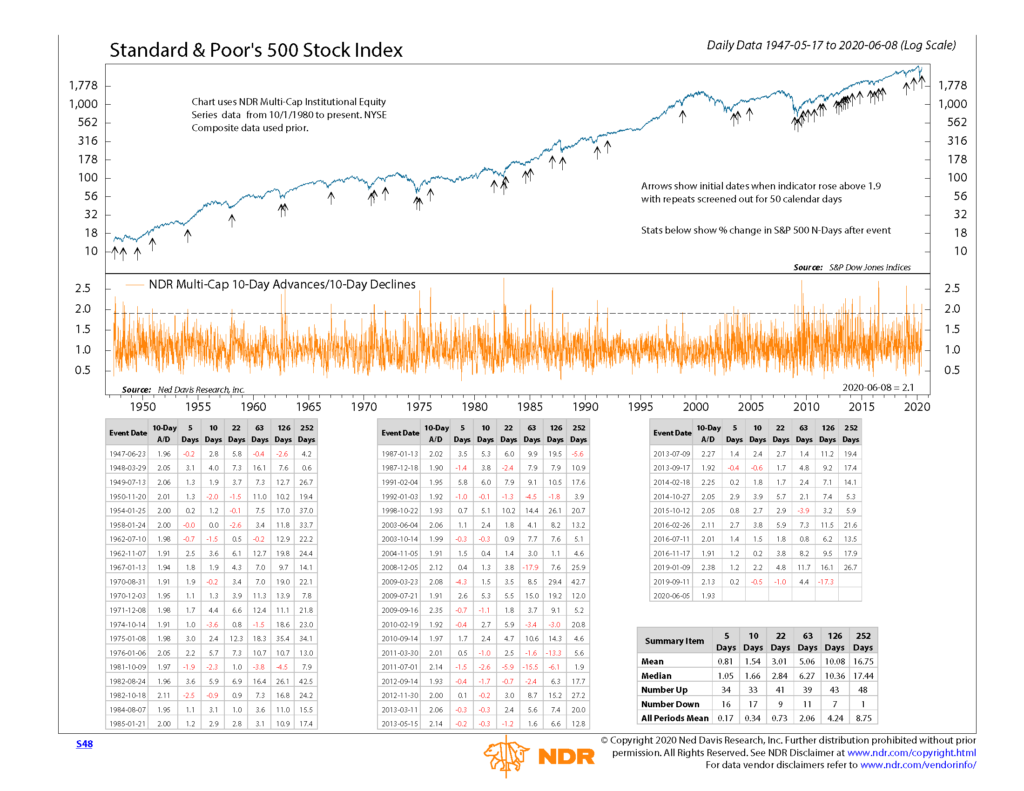
But we also look at more than just volume. Last week, the ratio of stocks advancing in price relative to the ones declining in price over the past ten days rose above 1.9. In other words, for every stock dropping in price, at least 1.9 stocks were increasing in price. This level is critical because it signals a “thrust” in market breadth or a surge in the number of stocks participating in a rally.

By one analysis, this level has been breached 50 times in the past 70 years or so. On average, stocks have gained about 5 percent over the next three months, 10 percent over the next six months, and more than 16.5 percent a year after this signal.
We generally place more weight on the market’s price movement, as it tends to be right more often than not. And as the saying goes, we like to “make the trend our friend.”
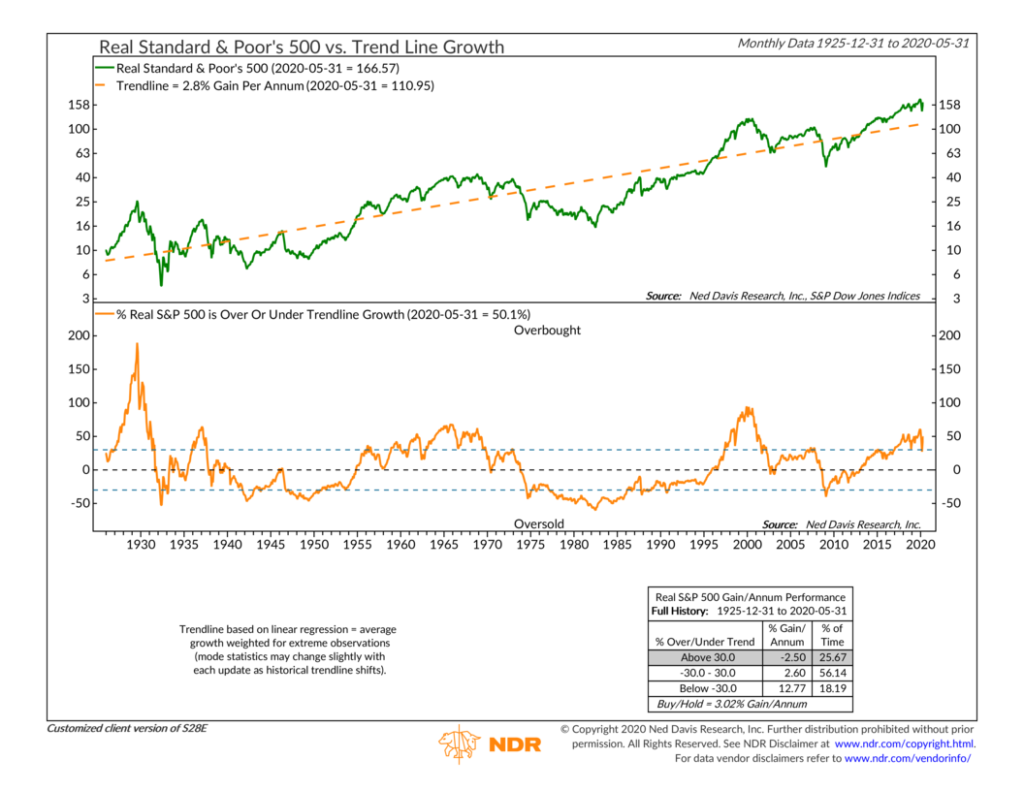
However, even if fundamental measures such as earnings are ignored, one concern is that the stock market remains overextended relative to its own trend line growth.
For example, if we fit a trendline (based on linear regression) to the S&P 500 index, we find that the real (inflation-adjusted) gain for the stock market is 2.8 percent per annum.
Currently, the real return of the S&P 500 is about 50 percent above that trendline.

Gains tend to come at a more rapid clip when the S&P 500 is no more than 30 percent above its real trendline growth. So while the current rally off the March lows has been quite intense, there are reasons to believe that, without another period of downward adjustment, returns going forward might come less easily.
This is intended for informational purposes only and should not be used as the primary basis for an investment decision. Consult an advisor for your personal situation.
Indices mentioned are unmanaged, do not incur fees, and cannot be invested into directly.
Past performance does not guarantee future results.
