OVERVIEW
Last week was a rollercoaster ride for U.S. stocks. The Dow managed a respectable climb, gaining 0.75%, but the S&P 500 dipped 0.83% and the Nasdaq took a steeper tumble, falling 2.08%.
Growth stocks had a rough time, down 2.12%, while value stocks enjoyed a 1.37% boost. Small-cap stocks were the week’s shining stars, surging over 3.5%.
Internationally, it wasn’t so rosy. Stocks in developed countries slipped 0.97%, and emerging markets fared worse, dropping 1.59%. The U.S. dollar stayed steady throughout the week.
Bonds had a solid performance, with the yield on the benchmark 10-year Treasury rate easing to 4.2%, helping the bond market rise about 0.3%.
Real estate enjoyed a modest gain of 0.88%. On the flip side, commodities took a hit, down 1.56% overall. Oil was the main culprit, plunging 2.42%, with gold also contributing to the decline, sliding 0.77%.
KEY CONSIDERATIONS
The Trend is Our Friend – It was another bumpy week for U.S. stocks. The S&P 500 dropped over 2% in one day on Wednesday, breaking its longest streak without a 2% drop since 2007.
But here’s the good news: the trend is still our friend.
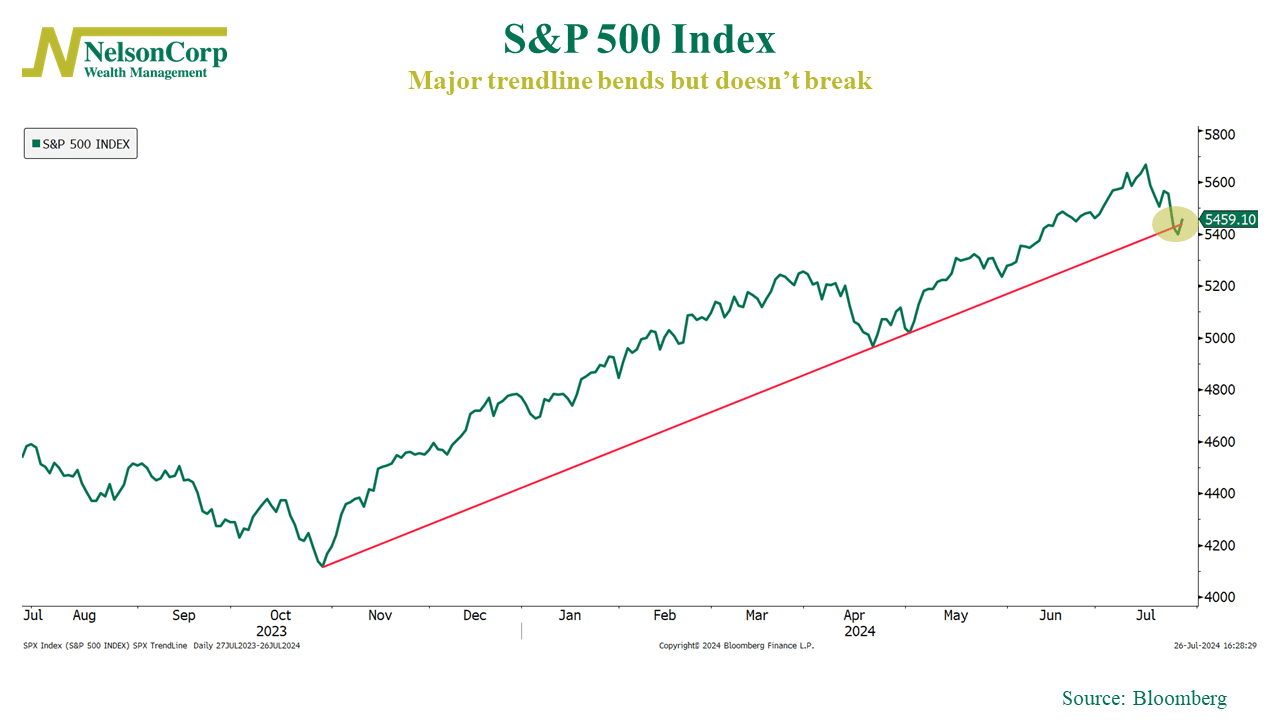
What does that mean? Look at this chart showing the trendline established from the October 2023 market low. I call it the “one trendline to rule them all.” Despite briefly dipping below it last week, a last-minute rally kept the market above the trendline.

Now, to be fair, that type of analysis is mostly for illustration. It doesn’t hold much substance on its own.
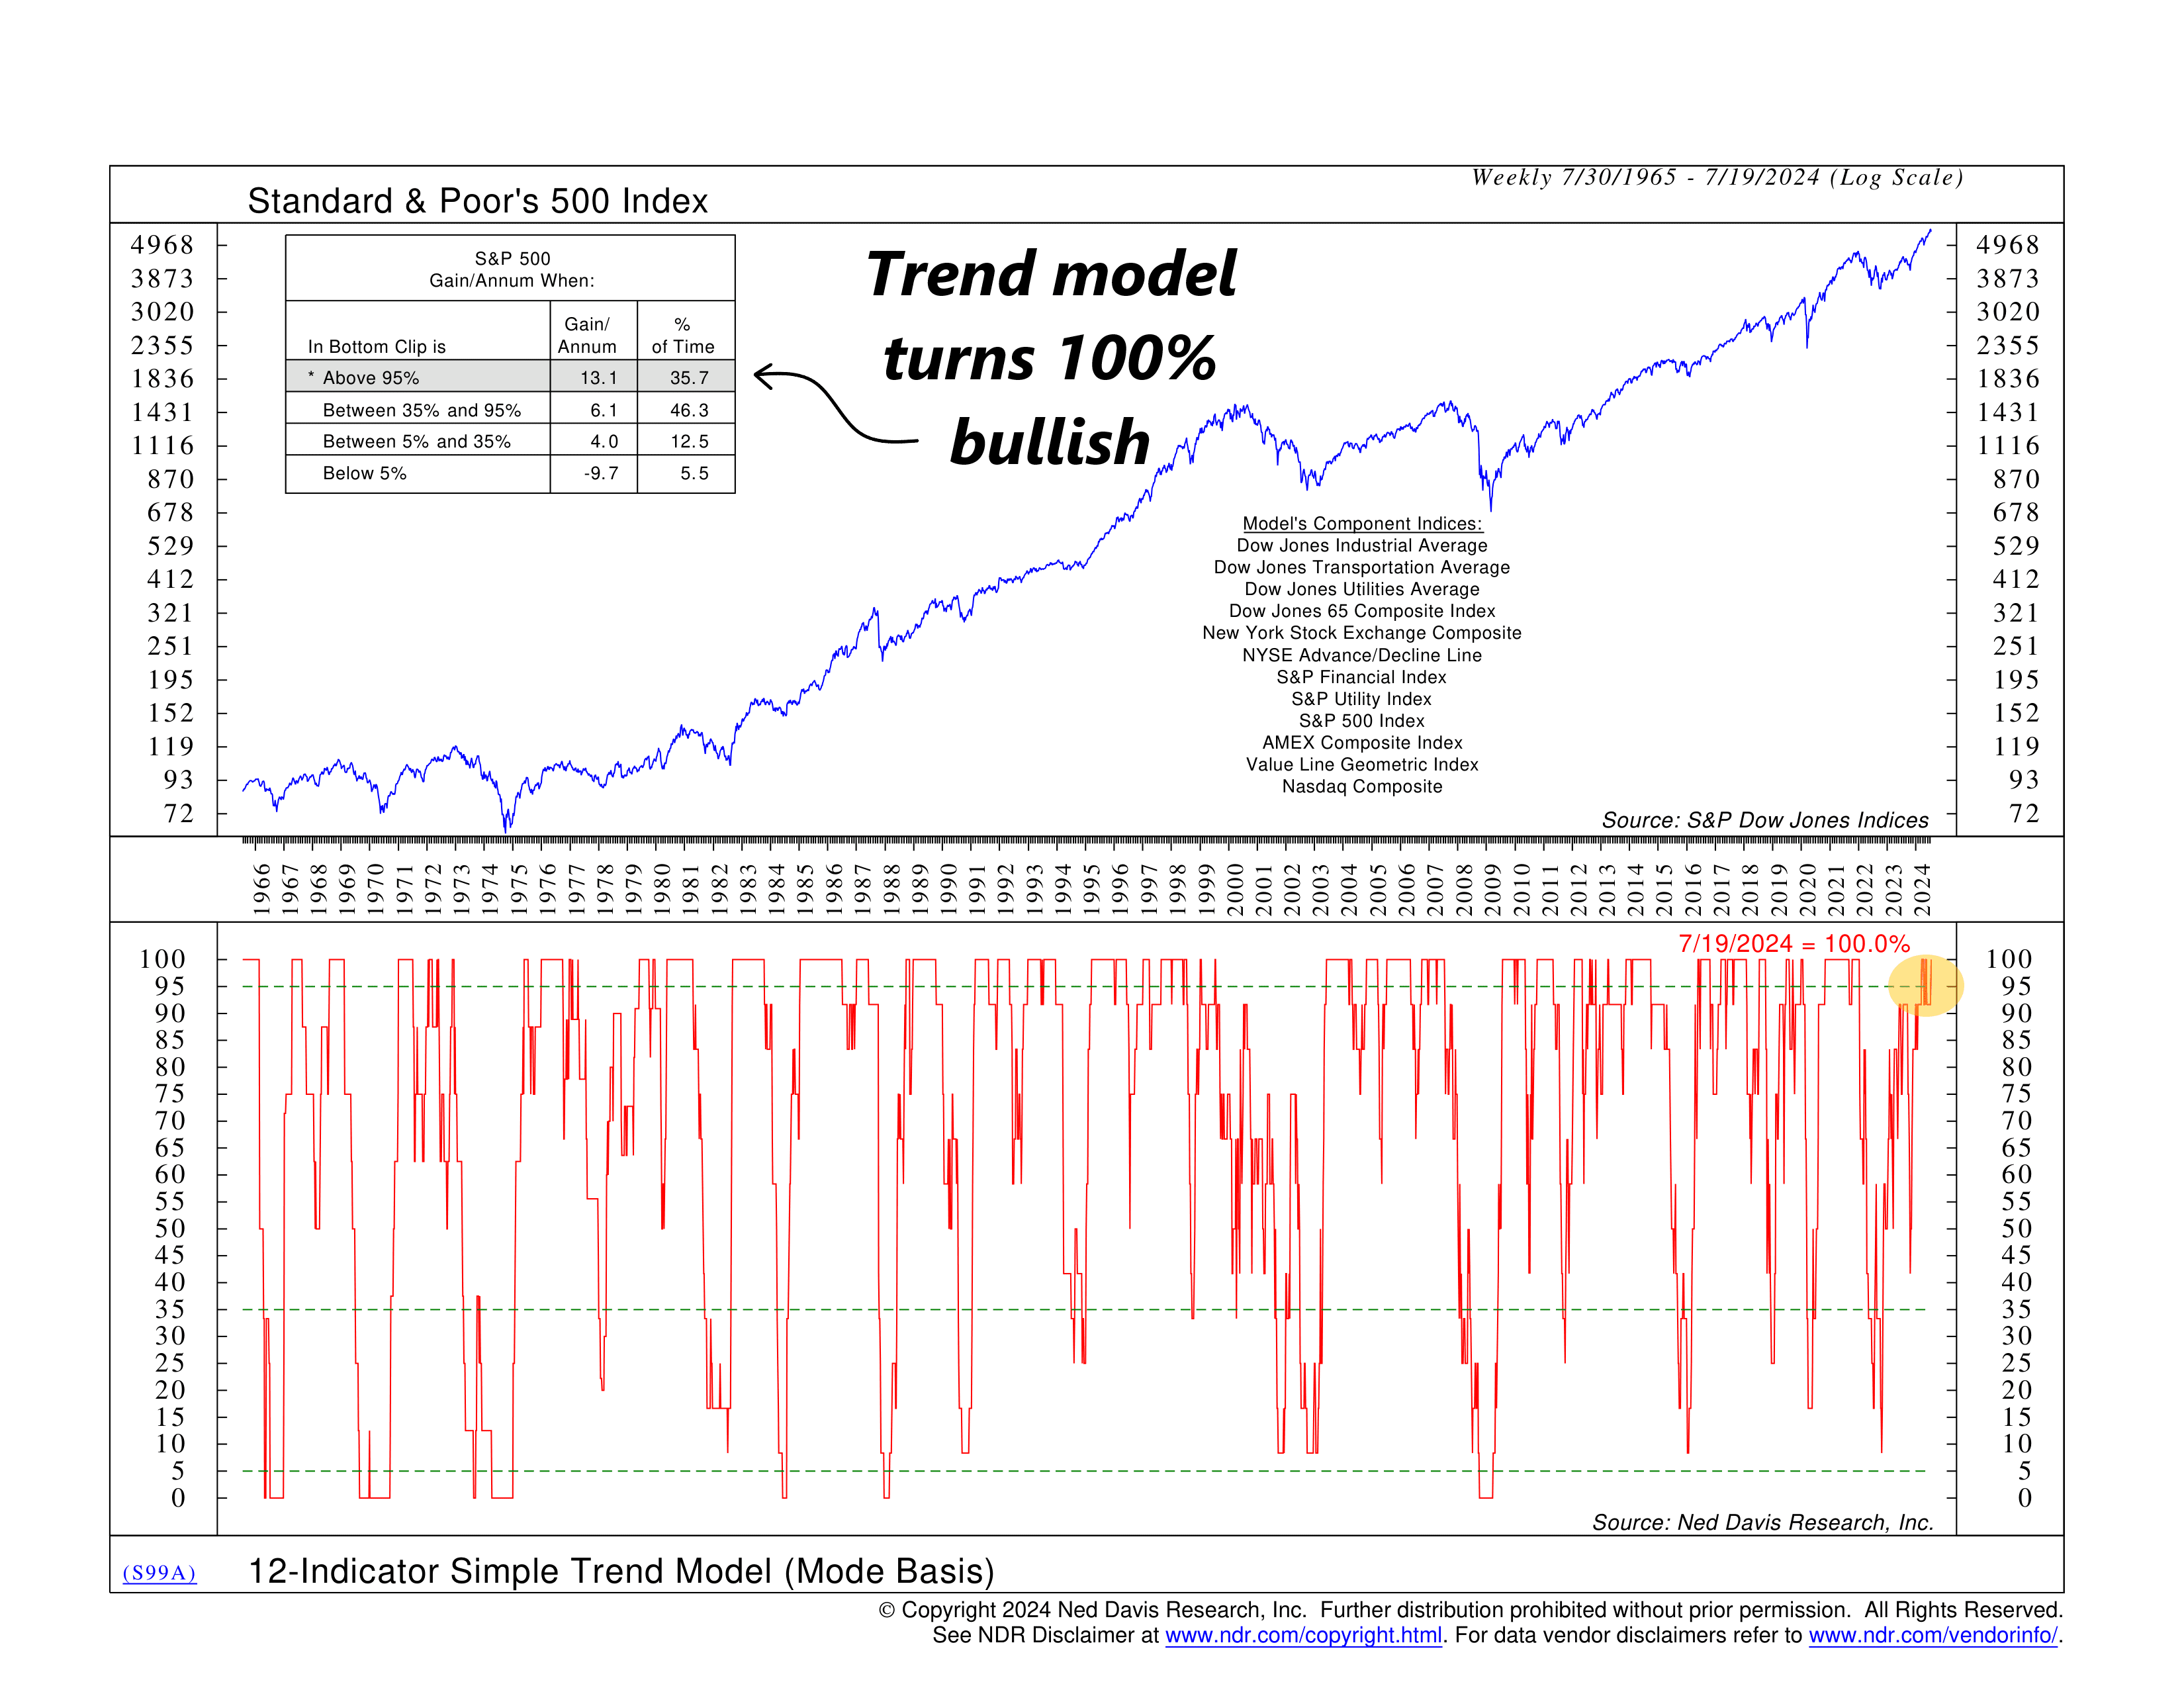
But let’s put some meat on the bones. This next chart is an indicator we use in our risk models. It tracks 12 separate indicators for 12 different U.S. markets or indexes, from the Dow and the Nasdaq to the financial and utility sectors.

Last week, it jumped to 100%, meaning all 12 markets are in established uptrends. Not bad. That’s as bullish as it gets.
Now, outside of market prices, things are a bit shakier. But the indicators have held up enough to keep things steady.
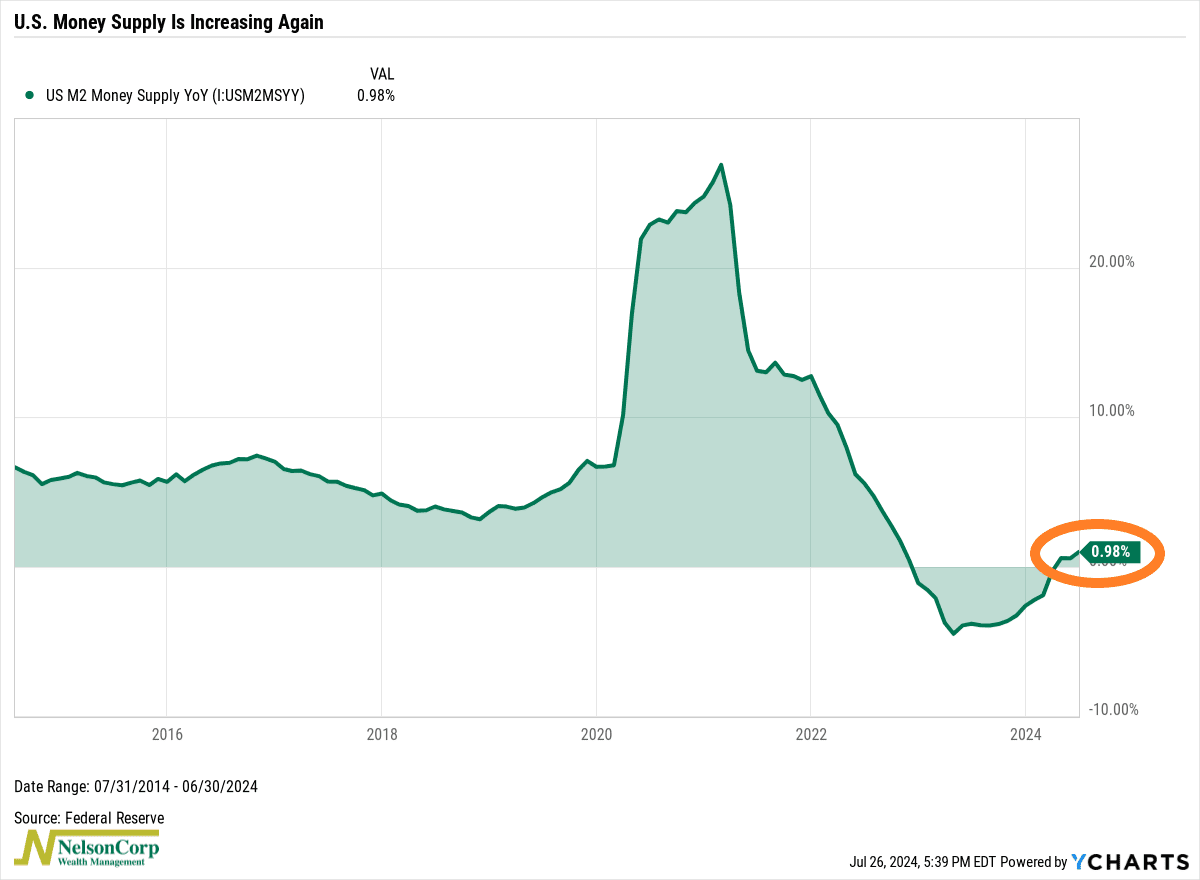
For example, we’ve seen the money supply increase year-over-year for three straight months now. Liquidity is an important factor for stock returns, so this is great to see.

So, to wrap it all up, the evidence suggests any current weakness is likely just a correction or brief pullback within a broader bull market—not the start of a prolonged downturn.
This is intended for informational purposes only and should not be used as the primary basis for an investment decision. Consult an advisor for your personal situation.
Indices mentioned are unmanaged, do not incur fees, and cannot be invested into directly.
Past performance does not guarantee future results.
The S&P 500 Index, or Standard & Poor’s 500 Index, is a market-capitalization-weighted index of 500 leading publicly traded companies in the U.S.
