OVERVIEW
It was a mixed week for U.S. stocks. While the Nasdaq edged out a gain of 0.16%, the S&P 500 fell 0.96% and the Dow dropped 2.68%. Small caps brought up the rear, dipping more than 3%.
International stocks also saw declines, with developed markets down 1.99% and emerging markets off by 1.75%. Meanwhile, the U.S. dollar strengthened by 0.86% against other major currencies.
The bond market faced headwinds as the 10-year Treasury yield rose to 4.25% from 4.08% the previous week, dragging down government bonds. Long-term Treasuries were down roughly 1.8% for the week. Overall, the U.S. bond market dipped about 0.9%.
In contrast, commodities shone, gaining over 2%. Oil led with nearly a 4% jump, gold edged up 0.9%, and corn climbed 2.6%. Real estate, on the other hand, dipped about 1.8% to end the week.
KEY CONSIDERATIONS
Time for a Check-In – The stock market has been showing some interesting signals lately. Let’s take a quick look at what’s happening beneath the surface.
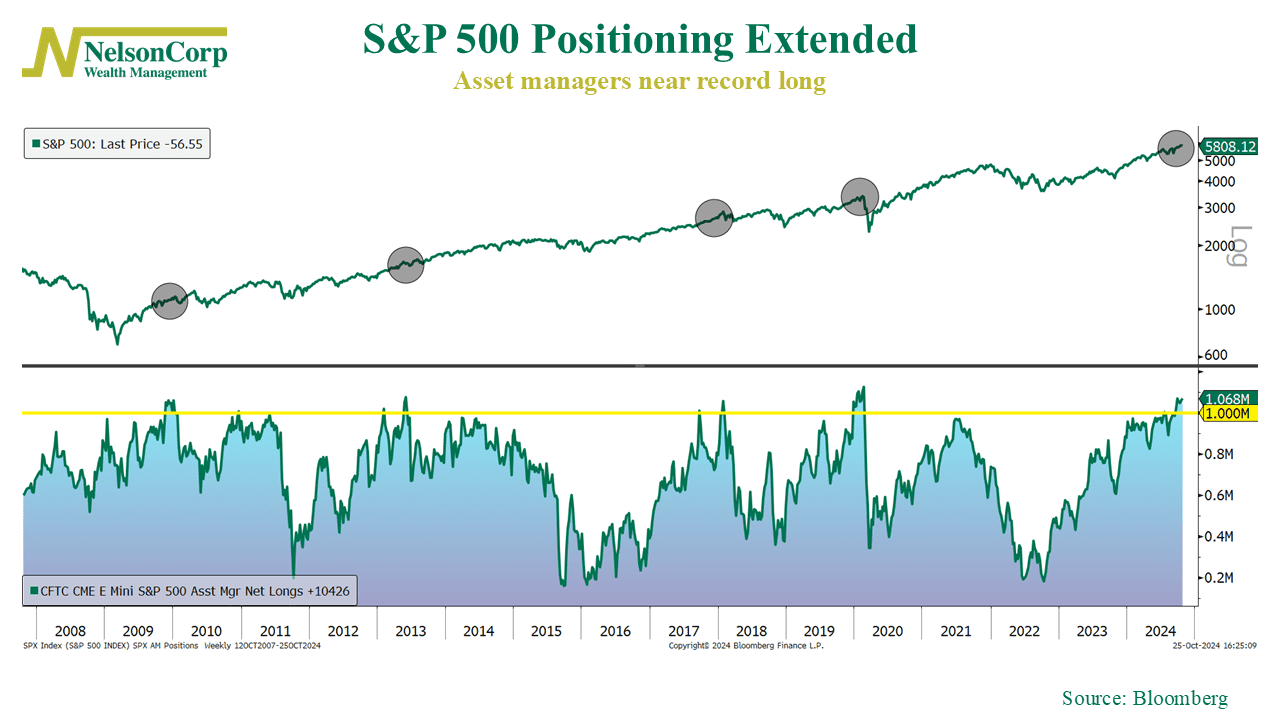
First, a sentiment indicator. As you can see on the chart below, asset managers are piling into the S&P 500 like crazy, holding some of the largest long positions we’ve seen in recent years.

This is somewhat concerning because this level of optimism often comes when the market is near a peak, which can be a red flag. Historically, when positions get this stretched, the market tends to cool off. It doesn’t mean a crash is imminent, but it does suggest we could be in for a bit of a breather soon.
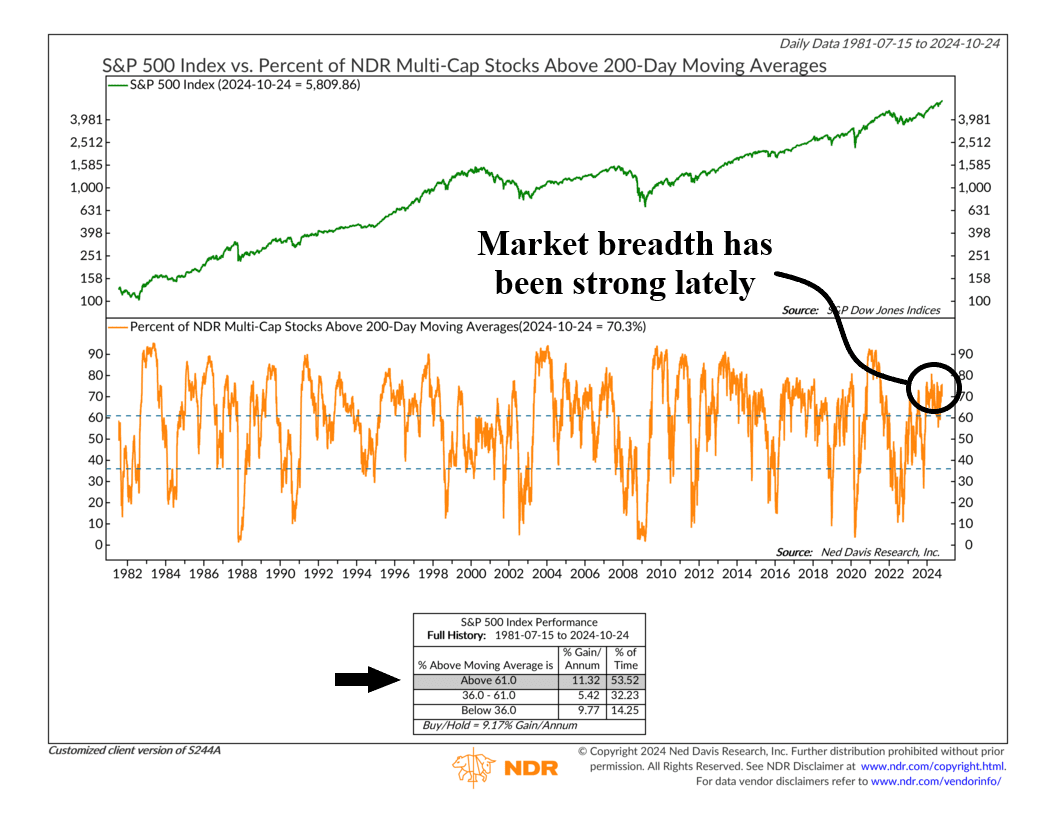
On a more positive note, however, we’re also seeing broader participation from stocks—which is probably why asset managers are so optimistic. As this next chart shows, more companies are trading above their 200-day moving average, which signals strength.

This kind of broad support usually bodes well for the market because it’s not just a handful of big names carrying the load. A market with widespread participation tends to be healthier and more sustainable.
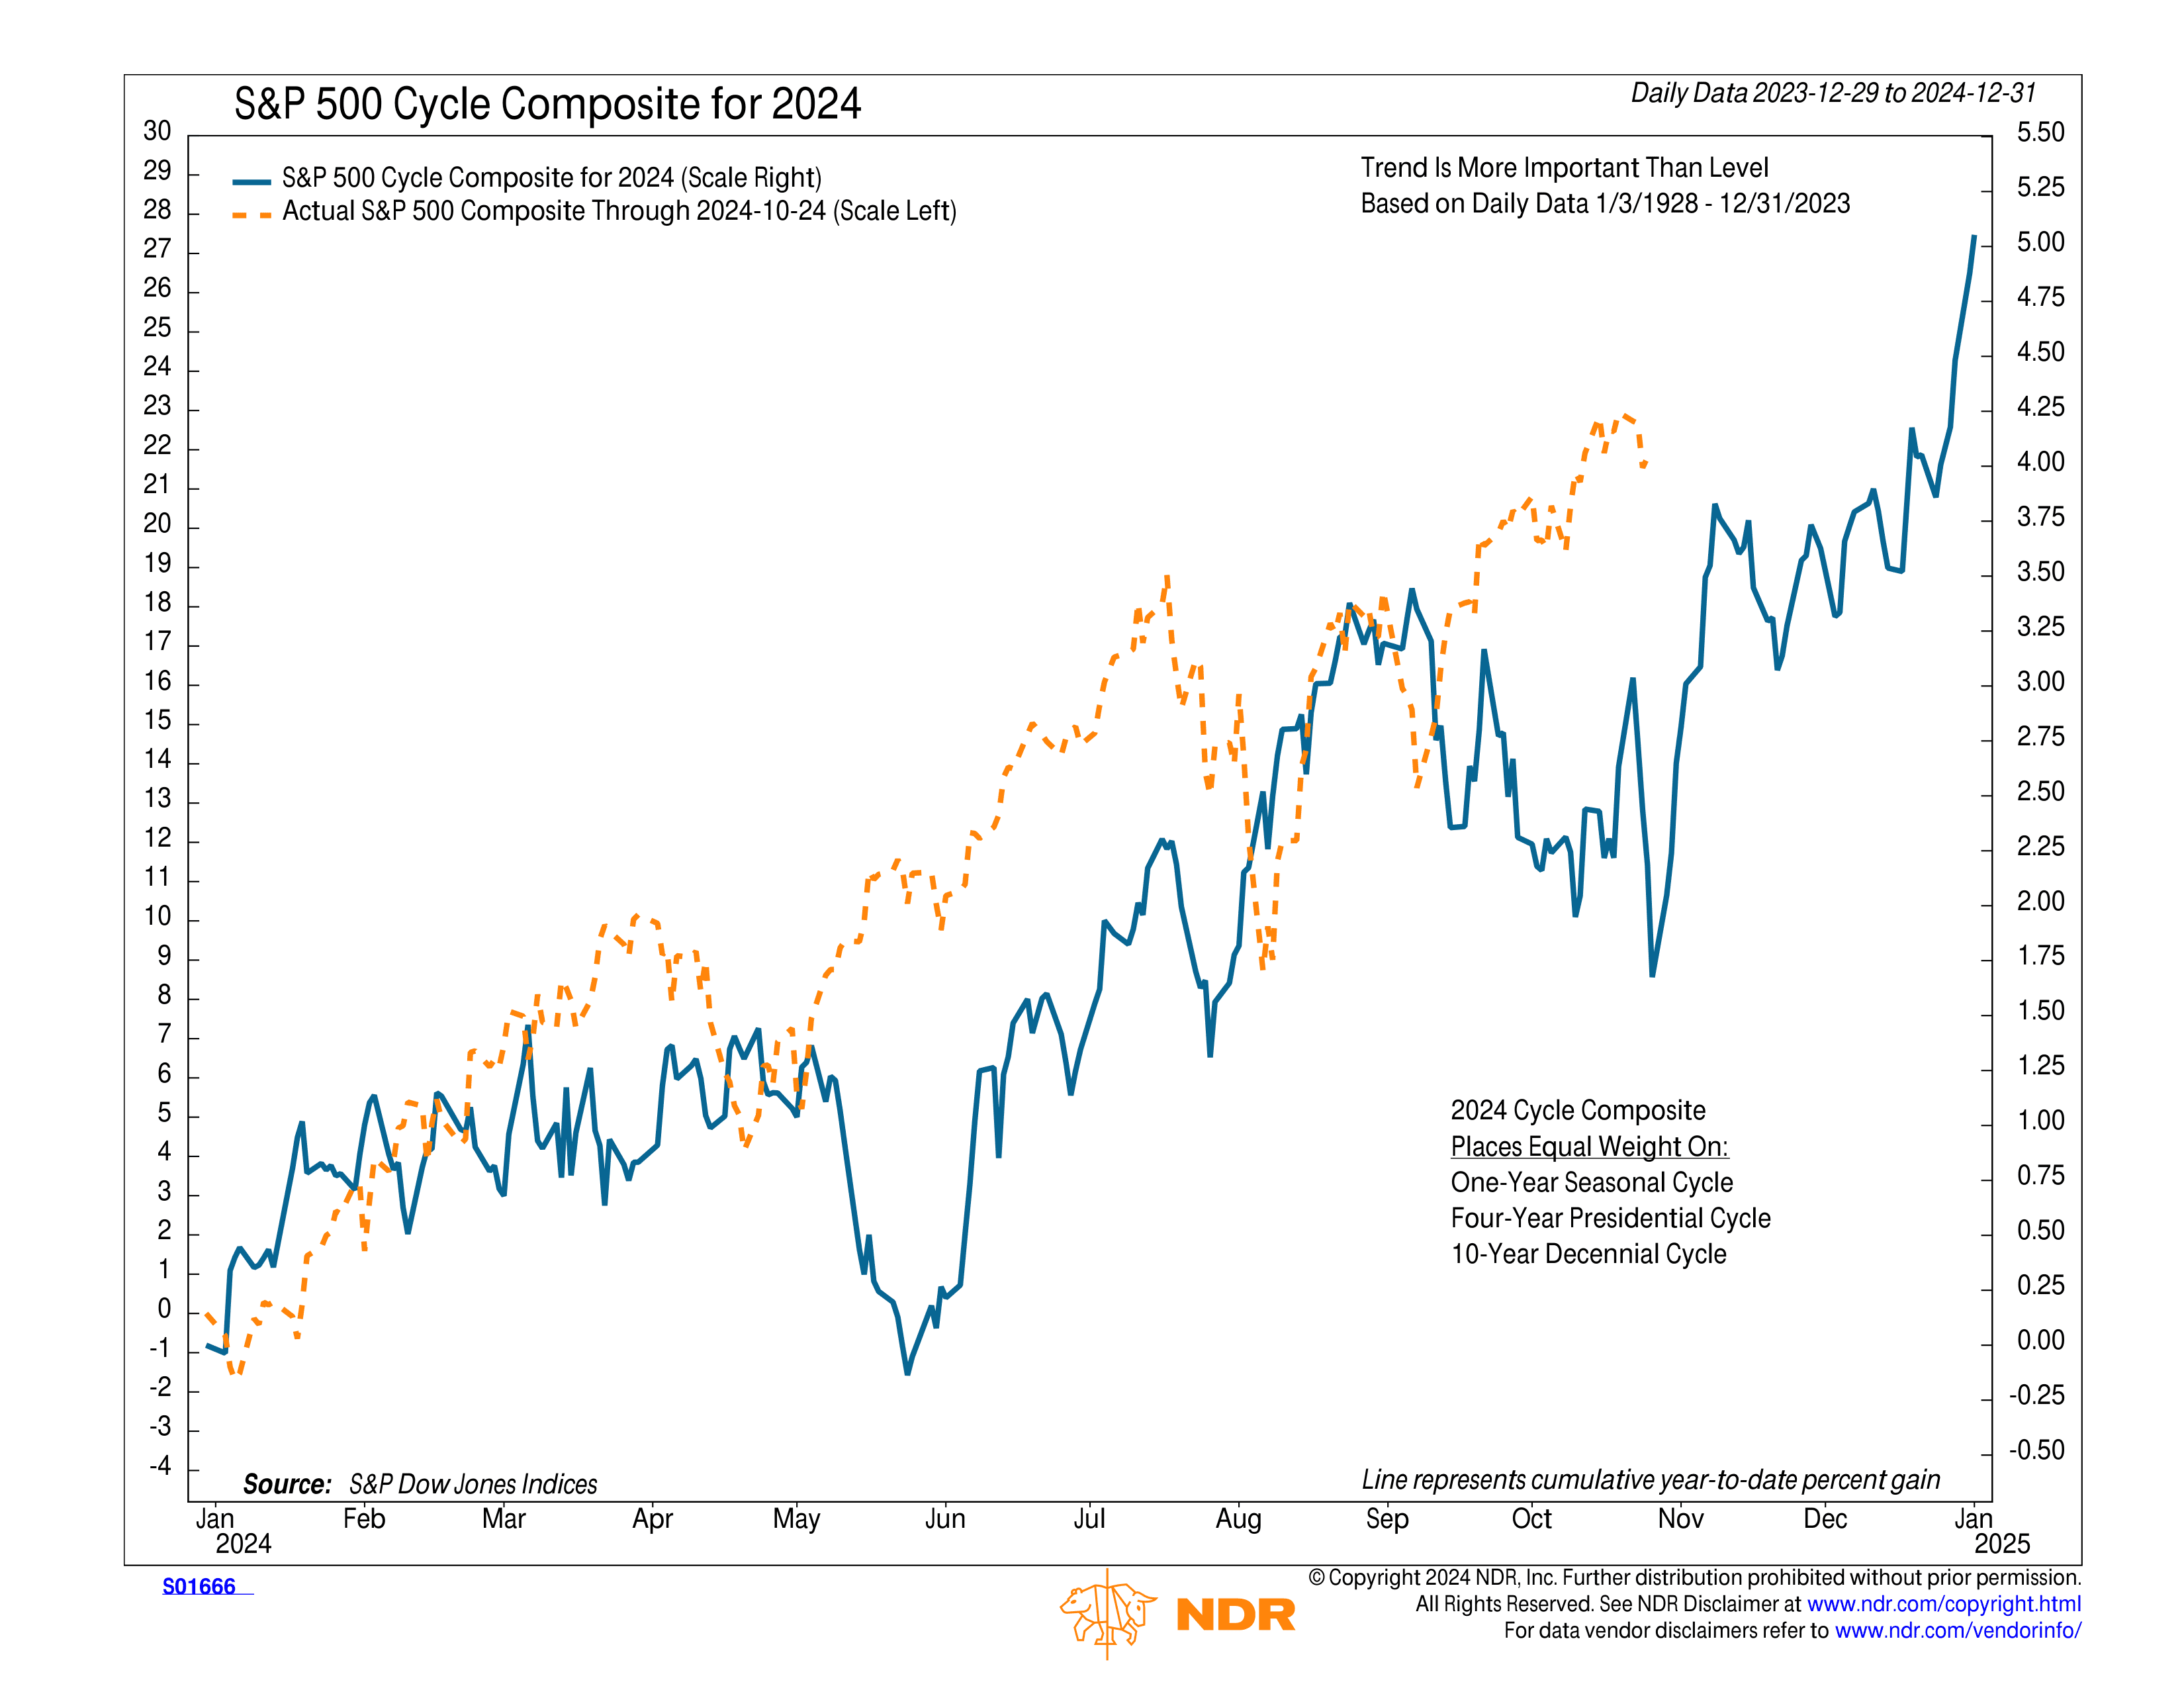
Lastly, seasonality is telling an encouraging story. As the 2024 cycle composite below shows, we’re entering the final months of the year, a time when markets historically do well.

This pattern suggests we could see further gains through the end of December. While the past doesn’t guarantee the future, the seasonal strength could provide some tailwinds for the market.
So, while there are some warning signs—like asset managers being overly optimistic—there’s also plenty of strength beneath the surface. And with the seasonal cycle on our side, the market could be set up for a strong finish to the year.
This is intended for informational purposes only and should not be used as the primary basis for an investment decision. Consult an advisor for your personal situation.
Indices mentioned are unmanaged, do not incur fees, and cannot be invested into directly.
Past performance does not guarantee future results.
The S&P 500 Index, or Standard & Poor’s 500 Index, is a market-capitalization-weighted index of 500 leading publicly traded companies in the U.S.
