OVERVIEW
Markets finished the week with a mix of winners and laggards. The S&P 500 rose 1.59%, while the Dow added a smaller 0.95%. The NASDAQ led the major U.S. benchmarks with a 2.03% gain. Broad measures were also strong, with the Russell 3000 up 1.48%. Growth stocks (+2.40%) outpaced value (+0.48%), continuing their recent advantage.
By size, the picture was more divided. Large caps (S&P 100) climbed 1.96%, but mid-caps (S&P 400) slipped 0.44%, and small caps (S&P 600) fell 0.54%. Overseas, developed markets (EAFE) gained 1.14%, while emerging markets surged 3.89%, the best of the week.
Bond markets were generally positive, particularly at the long end. Long-term Treasuries advanced 1.54%, with intermediates up 0.26% and short-term Treasuries edging higher by 0.08%. Investment-grade corporates added 0.59%, while high yield bonds rose 0.27%. Municipals gained 1.12%.
Commodities saw broad strength. Oil rose 0.94%, corn bounced 2.87%, and gold climbed 0.91%, holding onto a nearly 40% year-to-date lead. Broad commodities advanced 1.33%. Real estate added 0.37%, while MLPs dipped 0.08%.
The U.S. dollar was little changed, slipping 0.04%. Volatility fell further, with the VIX down 2.77% for the week.
KEY CONSIDERATIONS
Head on a Swivel– The U.S. stock market has been on a pretty remarkable run lately. After last Friday’s close, the S&P 500 has now gone 100 trading days straight without posting a single daily drop of 2% or more. That’s the second longest stretch in over five years, as you can see below.
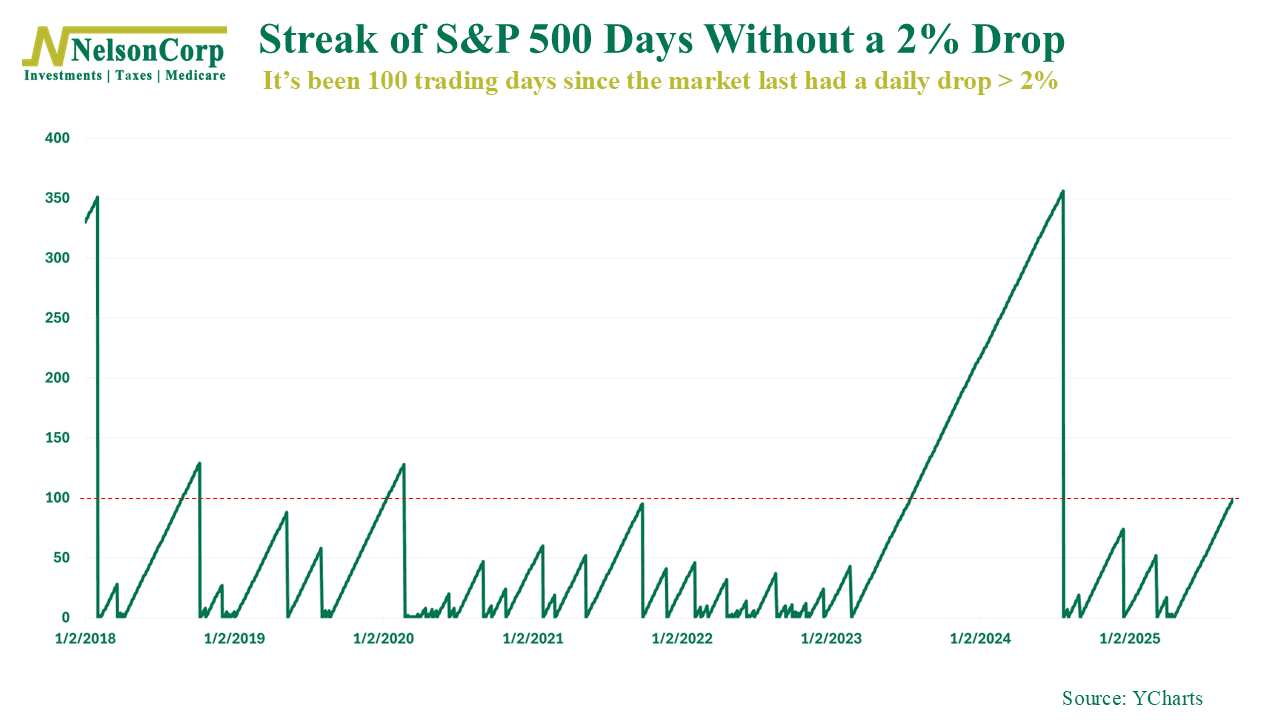
But here’s the thing. Calm water on the surface doesn’t always mean everything underneath is smooth sailing.
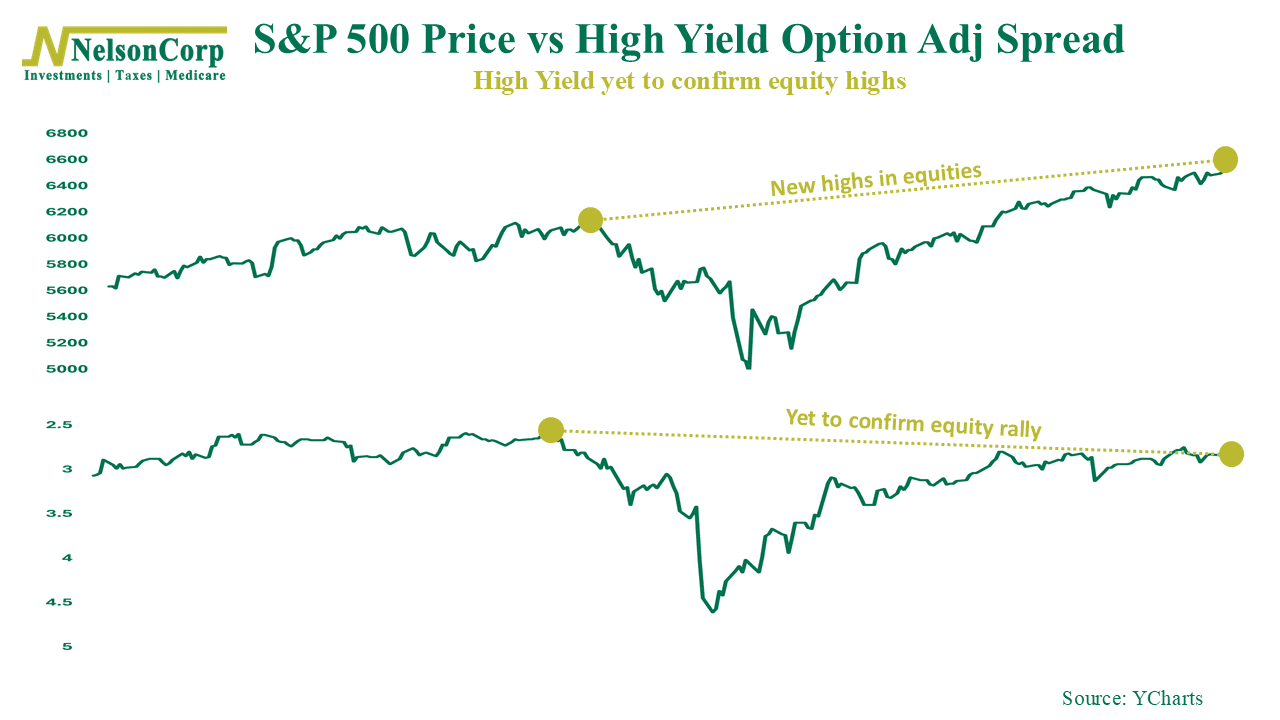
Take high-yield bonds, for example. While stocks have reached new highs, high-yield (junk) bonds haven’t completely confirmed the story yet. Credit is kind of dragging its feet here, a bit cautious to confirm the exuberant story in equities.
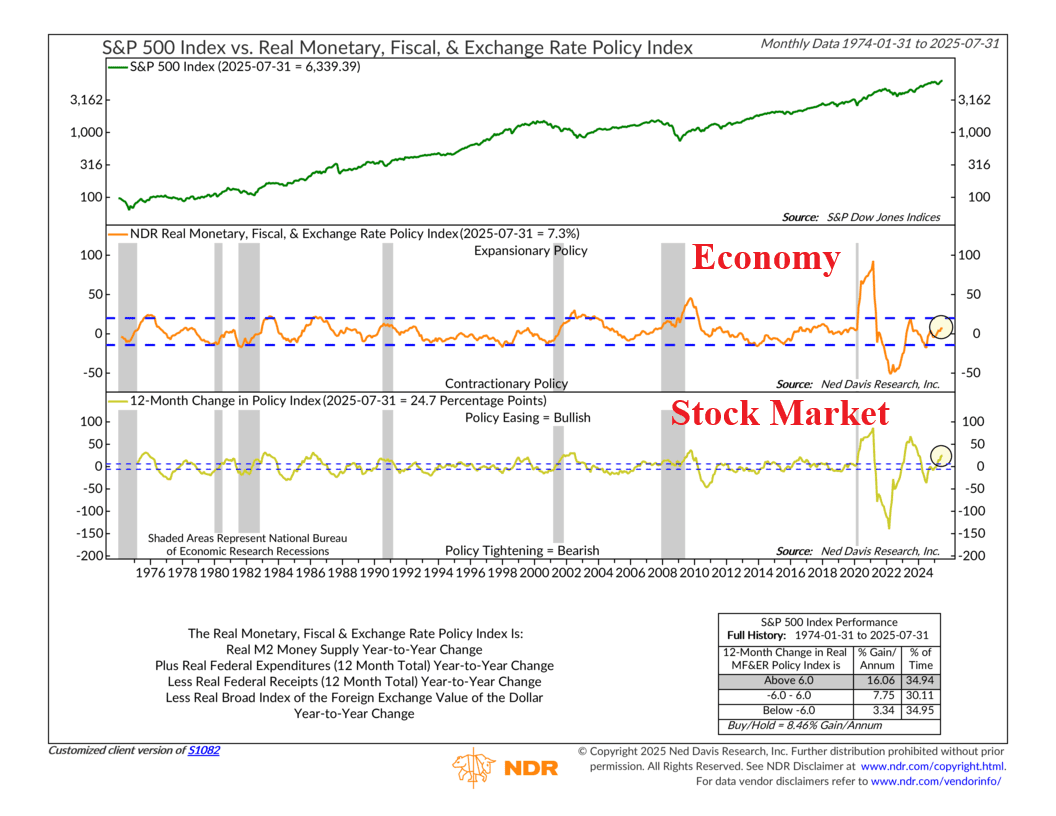
And this fits right in with what we talked about in this week’s Indicator Insights. That piece looked at how monetary policy, fiscal policy, and even the dollar all come together in one big measure of stimulus. Right now, the index is strong enough to confirm a bull market in stocks—but not quite strong enough to suggest a bullish economy.
OK, so what does this all mean? Well, for one, it shows how easy it is to get comfortable when volatility is quiet. Investors tend to let their guard down when the waves are calm. But as anyone who’s ever been caught in a Midwest thunderstorm knows, things can change pretty quickly.
A long stretch without big down days might feel comfortable, but it doesn’t mean risk has disappeared. To be sure, the weight of the evidence continues to lean bullish, but it’s important to remember that the calm doesn’t last forever.
This is intended for informational purposes only and should not be used as the primary basis for an investment decision. Consult an advisor for your personal situation.
Indices mentioned are unmanaged, do not incur fees, and cannot be invested into directly.
Past performance does not guarantee future results.
The S&P 500 Index, or Standard & Poor’s 500 Index, is a market-capitalization-weighted index of 500 leading publicly traded companies in the U.S.
The Dow Jones Industrial Average (DJIA) is a price-weighted index composed of 30 widely traded blue-chip U.S. common stocks. The Nasdaq 100 Index is a basket of the 100 largest, most actively traded U.S. companies listed on the Nasdaq stock exchange. The index includes companies from various industries except for the financial industry, like commercial and investment banks. The Russell 3000 Index is a capitalization-weighted stock market index that seeks to be a benchmark of the entire U.S. stock market. The S&P MidCap 400 is designed to measure the performance of 400 mid-sized companies, reflecting the distinctive risk and return characteristics of this market segment. S&P 600 Index measures the small-cap segment of the U.S. equity market. The index is designed to track companies that meet specific inclusion criteria to ensure that they are liquid and financially viable. The S&P 100 index is a capitalization-weighted index based on 100 highly capitalized stocks for which options are listed on the CBOE (Chicago Board of Exchange). The MSCI EAFE Index is an equity index which captures large and mid cap representation across 21 Developed Markets countries* around the world, excluding the US and Canada.
The Bloomberg U.S. Corporate Bond Index measures the investment grade, fixed-rate, taxable corporate bond market. The Bloomberg U.S. Corporate High Yield Index is comprised of domestic and corporate bonds rated Ba and below with a minimum outstanding amount of $150 million. The Bloomberg U.S. Municipal Index covers the USD-denominated long-term tax exempt bond market. The index has four main sectors: state and local general obligation bonds, revenue bonds, insured bonds and prerefunded bonds.