OVERVIEW
Markets were mixed last week, with technology and large-cap stocks leading gains while smaller companies and bonds struggled. The S&P 500 rose 0.71%, the Dow Jones Industrial Average gained 0.75%, and the NASDAQ jumped 2.24%. Broadly, the Russell 3000 added 0.50%, but value stocks fell 0.92% as growth continued to outperform.
Small and mid-caps slipped, with the S&P 400 (mid-caps) down 1.59% and the S&P 600 (small-caps) dropping 2.84%. Overseas, developed markets (EAFE) edged 0.47% lower, while emerging markets gained 0.87%, helped by strength in Asia and a weaker U.S. dollar.
Bond markets declined as longer yields pushed higher. Long-term Treasuries fell 1.23%, intermediate-term bonds slipped 0.48%, and investment-grade issues declined 0.85%. High-yield bonds held nearly flat at -0.08%, while municipal bonds eased 0.11%.
Commodities were a mixed bag. Oil fell 0.85%, and gold slid 3.41%, giving back some of its strong year-to-date gains. Real estate tumbled 3.52%, pressured by rising yields, while corn climbed 1.95%. The U.S. dollar strengthened 1.07%, and volatility jumped—the VIX surged 6.54%, signaling renewed investor caution after recent market strength.
KEY CONSIDERATIONS
No Data No Problem – As many of you know, the U.S. government has been shut down for a while now—about a month—the second longest on record and close to becoming the longest. That’s a long time, and it’s starting to have ripple effects.
One major impact is that we’re no longer receiving official government economic data. Much of this information is released monthly, so the longer the shutdown lasts, the larger its impact becomes.
Jay Powell, chair of the Federal Reserve, likened this to a “data fog.” What do you do when you drive into a fog and can’t see very well? You slow down. Maybe the Fed will have to do the same?
We’ll see. Maybe the shutdown ends soon and there ends up being no real impact. But if it doesn’t, will it affect what we do?
Possibly. Some of our economic indicators rely on government data, which could become stale. That said, the overall effect on our process should be minimal—because a large section of most of our models rely on price-based data, which comes directly from market action, not government reports.
Here’s what the price-based component of our primary stock market risk model looks like right now:
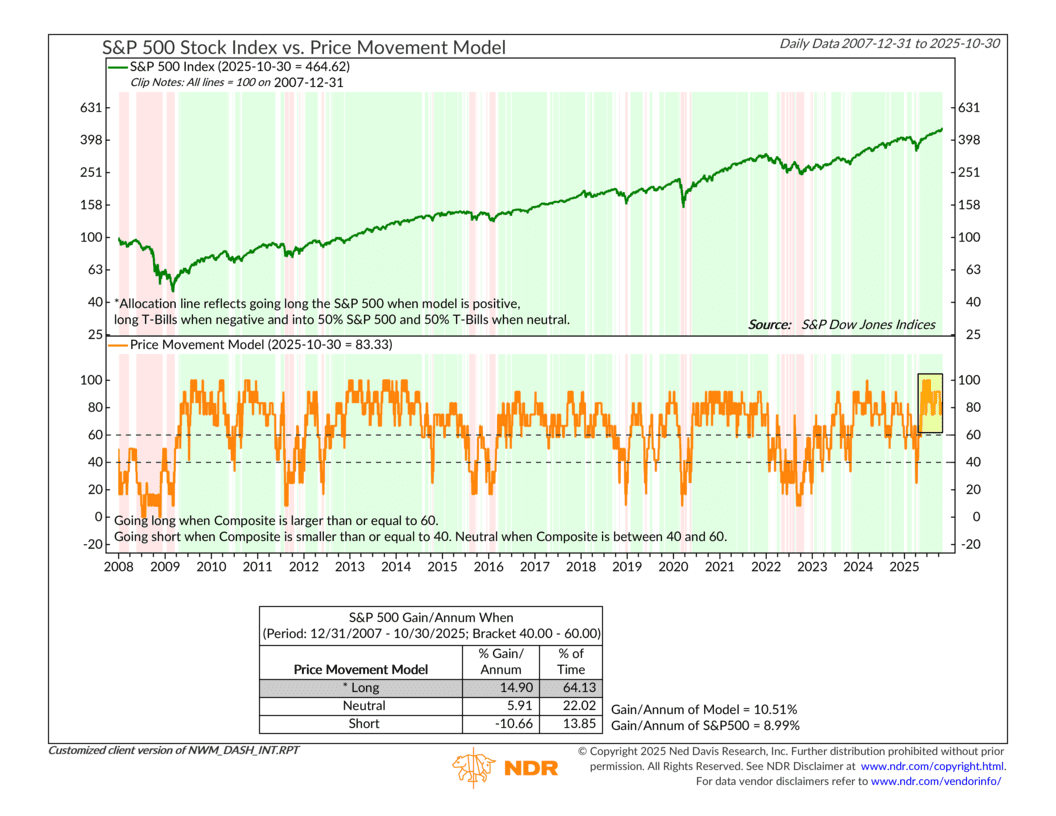
83% bullish—that’s great! Many of the indicators within this model track things like trend, momentum, and participation—all of which are independent of government data.
There is one that I like to watch particularly closely, and that is the 85-day stochastic indicator (shown below). It’s a momentum tool that measures how strong or weak the market’s current trend is compared to its price range over the past 85 days. It helps identify potential turning points in momentum.
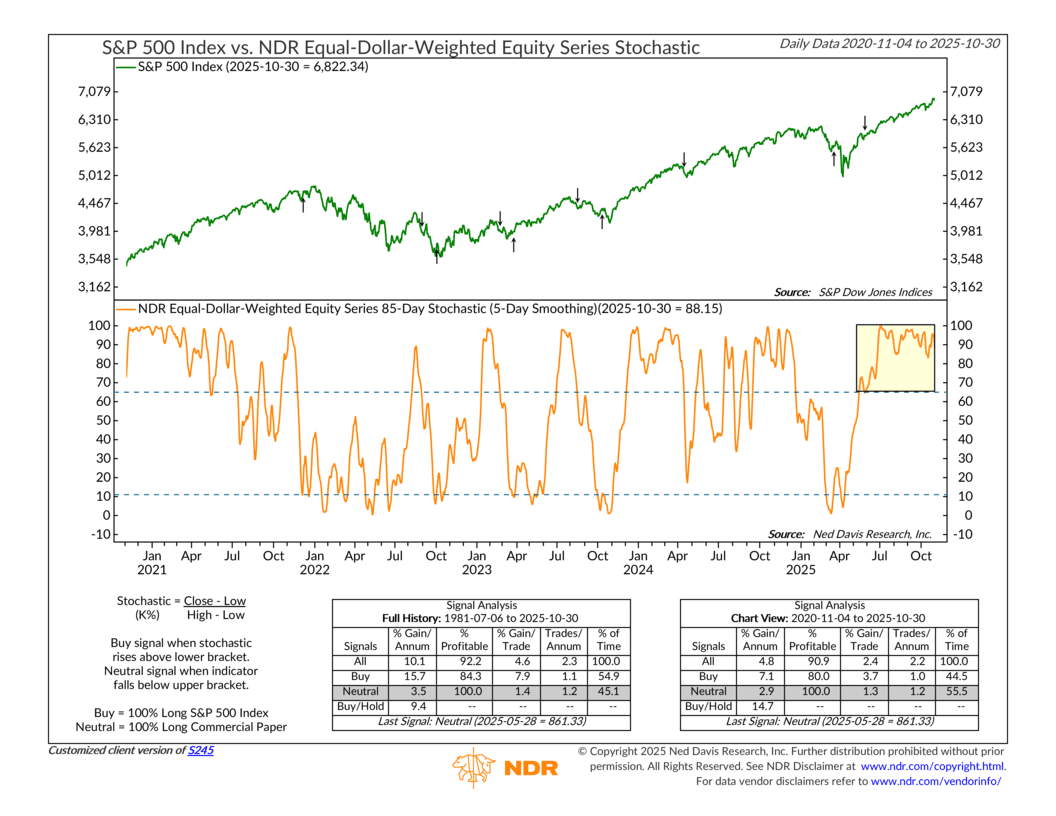
As you can see, it tried to trigger a sell signal back in May but quickly reversed and has remained in its upper range ever since. In other words, market momentum remains strong.
It’s hard to fool this indicator, so we’ll know something has truly shifted when it finally turns down and drops below its upper dashed line for a meaningful period of time. But for now, it continues to ward off going negative.
So, the bottom line? While we may be in a bit of a “data fog” when it comes to official government data, the market’s price action continues to be alive and well. And right now, the message remains fairly bullish until proven otherwise.
This is intended for informational purposes only and should not be used as the primary basis for an investment decision. Consult an advisor for your personal situation.
Indices mentioned are unmanaged, do not incur fees, and cannot be invested into directly.
Past performance does not guarantee future results.
The S&P 500 Index, or Standard & Poor’s 500 Index, is a market-capitalization-weighted index of 500 leading publicly traded companies in the U.S.
The Dow Jones Industrial Average (DJIA) is a price-weighted index composed of 30 widely traded blue-chip U.S. common stocks. The Nasdaq 100 Index is a basket of the 100 largest, most actively traded U.S. companies listed on the Nasdaq stock exchange. The index includes companies from various industries except for the financial industry, like commercial and investment banks. The Russell 3000 Index is a capitalization-weighted stock market index that seeks to be a benchmark of the entire U.S. stock market. The S&P MidCap 400 is designed to measure the performance of 400 mid-sized companies, reflecting the distinctive risk and return characteristics of this market segment. S&P 600 Index measures the small-cap segment of the U.S. equity market. The index is designed to track companies that meet specific inclusion criteria to ensure that they are liquid and financially viable. The S&P 100 index is a capitalization-weighted index based on 100 highly capitalized stocks for which options are listed on the CBOE (Chicago Board of Exchange). The MSCI EAFE Index is an equity index which captures large and mid cap representation across 21 Developed Markets countries* around the world, excluding the US and Canada.
The Bloomberg U.S. Corporate Bond Index measures the investment grade, fixed-rate, taxable corporate bond market. The Bloomberg U.S. Corporate High Yield Index is comprised of domestic and corporate bonds rated Ba and below with a minimum outstanding amount of $150 million. The Bloomberg U.S. Municipal Index covers the USD-denominated long-term tax exempt bond market. The index has four main sectors: state and local general obligation bonds, revenue bonds, insured bonds and prerefunded bonds.