OVERVIEW
Markets pulled back modestly over the week, with most U.S. equity indexes finishing slightly lower. Large-cap stocks were under mild pressure, as the S&P 500 fell 0.35% and the Dow Jones Industrial Average declined 0.53%. The NASDAQ was essentially flat, down just 0.06%, while the S&P 100 slipped 0.41%, showing continued hesitation among the largest companies.
Beneath the surface, participation remained mixed. Mid- and small-cap stocks also finished lower on the week, with the S&P 400 down 0.55% and the S&P 600 lower by 0.40%. Within the Russell 3000, value stocks held up better than growth, declining 0.19% versus a 0.49% drop for growth. Even with the weekly pullback, smaller-cap and value areas continue to show stronger year-to-date momentum.
International equities were a relative bright spot. Developed international markets edged higher, with EAFE up 0.13%, while emerging markets gained a solid 1.09% on the week. Emerging markets, in particular, continue to build on a strong start to the year.
Fixed income posted small but steady gains. Treasuries across the curve were modestly higher, and credit-oriented areas such as investment-grade and high-yield bonds also finished the week in positive territory. Overall, bond markets reflected a relatively calm backdrop despite equity market choppiness.
Commodities stood out as a source of strength. Broad commodities surged 5.27% on the week, led by sharp gains in gold, which jumped 8.37%, and oil, up 3.21%. In contrast, real estate declined 2.25%, giving back some recent gains. The U.S. dollar weakened, falling 1.90%, which likely provided a tailwind for commodity prices.
Volatility moved slightly higher, with the VIX up 1.45% on the week. Even so, overall volatility levels remain consistent with a market that is rotating and consolidating rather than signaling broad stress.
KEY CONSIDERATIONS
The Balance of Risk – One topic that’s been getting more attention lately is speculation in the stock market. One way to measure that is to look at margin debt.
Margin debt tracks how much investors are borrowing to invest in stocks, and it tends to rise when confidence is high and markets are moving higher.
We’re seeing that now for sure. As the following chart shows, margin debt is quite elevated—about $1.22 trillion, to be exact.
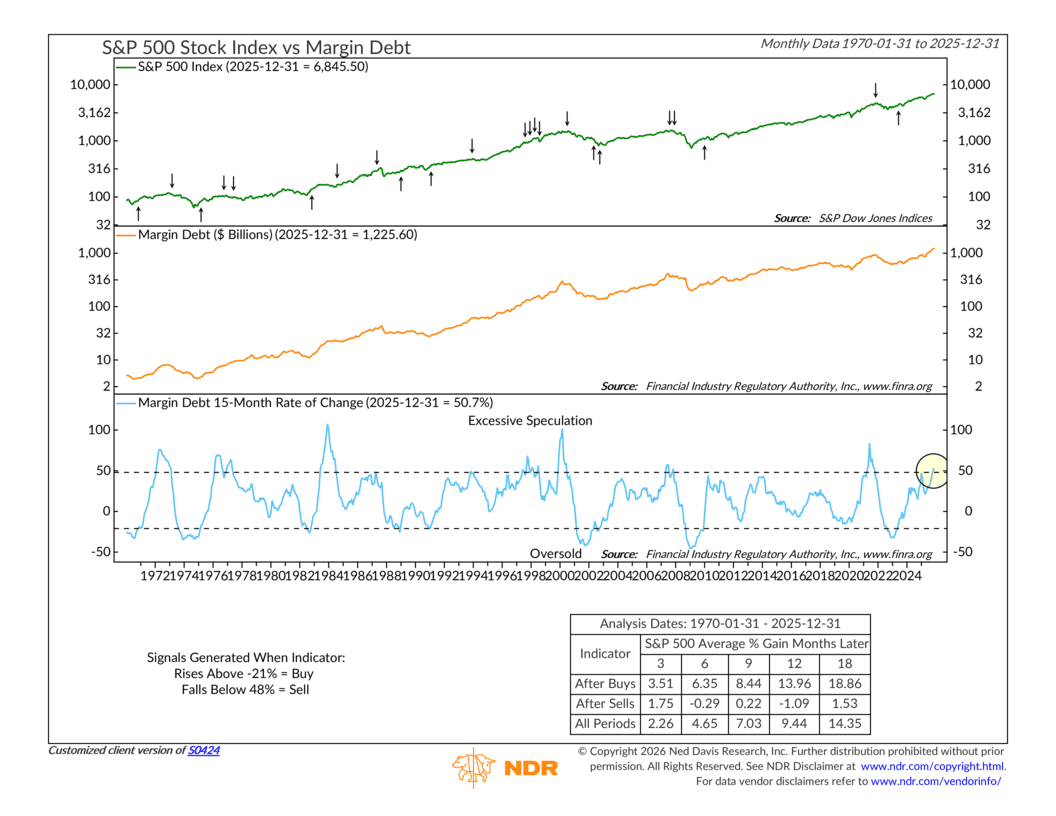
That can sound concerning, but it’s important to keep the context straight. Margin debt usually becomes a problem when it starts to fall, not when it’s rising. Indeed, the bottom part of the indicator shows that the 15-month rate of change of margin debt is now over 50%. If that rolls over and drops below 48%, then we’ll have some problems.
That’s a risk, sure. But what matters most right now is how the market is handling that risk.
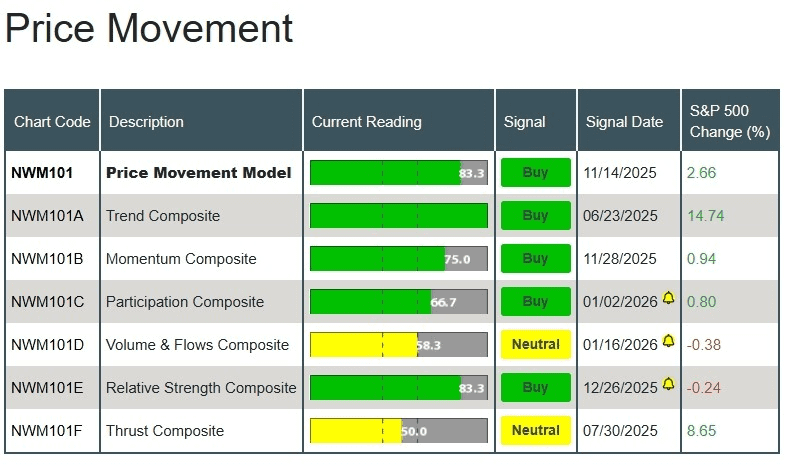
From a price perspective, things still look constructive. Trend, momentum, participation, and relative strength are all positive in our model. For the most part, this isn’t a narrow or fragile rally. Market participation remains broad, and price trends are still “doing work.”
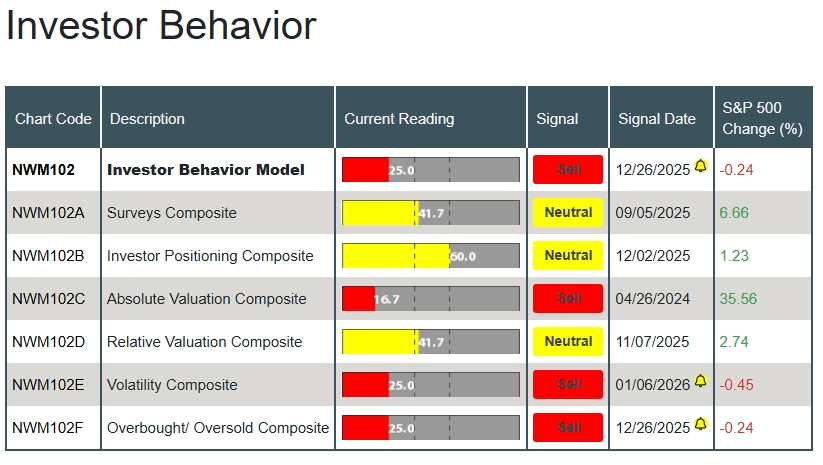
Where we do see some caution is in investor behavior. Valuations are stretched, volatility measures are elevated, and overbought conditions are showing up more often.
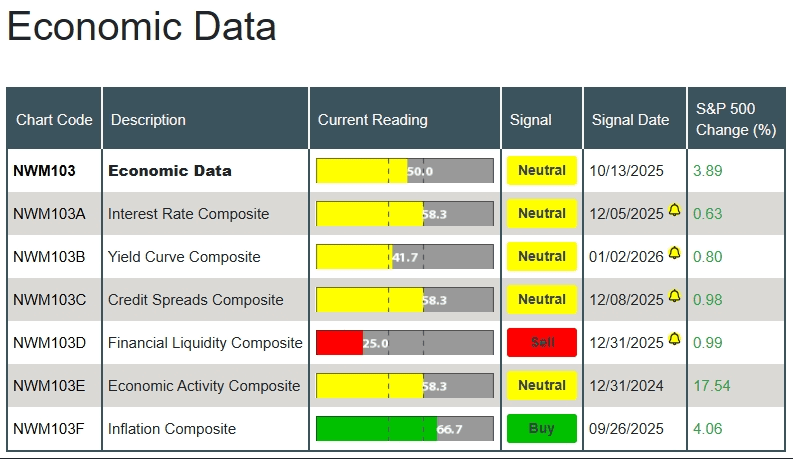
The economic backdrop, meanwhile, remains fairly steady. Interest rates, credit spreads, and economic activity are all neutral in our model, and inflation trends remain supportive.
In other words, the economy isn’t the pressure point right now. Investor behavior is. To be sure, that’s not abnormal. It’s rare to see all three components firing on the same cylinder. But it’s the situation we find ourselves in today, so it’s worth noting.
The bottom line? The trend is still your friend, and the market continues to confirm that strength. At the same time, rising leverage and aggressive positioning mean discipline matters more than usual. This is a market that rewards staying invested, but it also rewards balance and risk management.
This is intended for informational purposes only and should not be used as the primary basis for an investment decision. Consult an advisor for your personal situation.
Indices mentioned are unmanaged, do not incur fees, and cannot be invested into directly.
Past performance does not guarantee future results.
The S&P 500 Index, or Standard & Poor’s 500 Index, is a market-capitalization-weighted index of 500 leading publicly traded companies in the U.S.
The Dow Jones Industrial Average (DJIA) is a price-weighted index composed of 30 widely traded blue-chip U.S. common stocks. The Nasdaq 100 Index is a basket of the 100 largest, most actively traded U.S. companies listed on the Nasdaq stock exchange. The index includes companies from various industries except for the financial industry, like commercial and investment banks. The Russell 3000 Index is a capitalization-weighted stock market index that seeks to be a benchmark of the entire U.S. stock market. The S&P MidCap 400 is designed to measure the performance of 400 mid-sized companies, reflecting the distinctive risk and return characteristics of this market segment. S&P 600 Index measures the small-cap segment of the U.S. equity market. The index is designed to track companies that meet specific inclusion criteria to ensure that they are liquid and financially viable. The S&P 100 index is a capitalization-weighted index based on 100 highly capitalized stocks for which options are listed on the CBOE (Chicago Board of Exchange). The MSCI EAFE Index is an equity index which captures large and mid cap representation across 21 Developed Markets countries* around the world, excluding the US and Canada.
The Bloomberg U.S. Corporate Bond Index measures the investment grade, fixed-rate, taxable corporate bond market. The Bloomberg U.S. Corporate High Yield Index is comprised of domestic and corporate bonds rated Ba and below with a minimum outstanding amount of $150 million. The Bloomberg U.S. Municipal Index covers the USD-denominated long-term tax exempt bond market. The index has four main sectors: state and local general obligation bonds, revenue bonds, insured bonds and prerefunded bonds.