OVERVIEW
Markets leaned more risk-off last week, with pressure concentrated in large-cap growth. The S&P 500 fell 1.39%, the Dow Jones Industrials lost 1.23%, and the NASDAQ dropped 2.10%. The damage was most visible in mega-cap names, as the S&P 100 declined 2.36%, while a late-week bounce helped prevent even steeper losses.
Under the surface, value continued to show relative resilience. Russell 3000 Growth fell 2.12% and is now down more than 5% year to date, while Russell 3000 Value slipped just 0.40% for the week and remains up 6.59% in 2026. Mid- and small-cap stocks held up comparatively well, with the S&P 400 down 0.66% and the S&P 600 off 0.82%, both still sporting strong year-to-date gains.
International markets were a bright spot. Developed markets rose 1.92% and emerging markets gained 3.24% on the week, adding to already solid 2026 performance. The U.S. dollar fell 0.70%, which likely provided a tailwind for overseas equities.
Fixed income delivered steady gains across the curve. Short-, intermediate-, and long-term Treasuries all finished higher, with long bonds up 2.50%. Credit-sensitive areas such as investment-grade, high yield, and emerging market debt also advanced.
Real assets were mixed but constructive overall. MLPs jumped 3.50% and real estate gained 2.54%. Oil slipped 1.00% and broad commodities edged lower, but gold continued its strong run, climbing 1.34% and now up more than 16% year to date. Volatility spiked nearly 16% on the week.
KEY CONSIDERATIONS
Risk Premium – So there’s this basic idea in finance that stocks need to offer a clear premium over bonds because they carry more risk. Why take extra risk if you don’t need to?
We call this a “risk premium.” Traditionally, the way to measure it is by looking at the earnings yield for the stock market and comparing it to the yield on 10-year Treasuries.
The earnings yield is simply the inverse of the price-to-earnings ratio. Right now, for the S&P 500, it is about 3.7%. In other words, for every $100 you buy of the S&P 500, the underlying stocks are currently generating about $3.70 in profit for you. It’s not a bond coupon, but psychologically, investors compare it to bond yields all the time.
As for the 10-year Treasury bond, it’s currently yielding about 4.09%. As you can see, there’s a bit of a problem here. 4.09% is bigger than 3.7%. That means there is no risk premium for owning stocks over bonds right now. You can see this clear shift on the chart below.
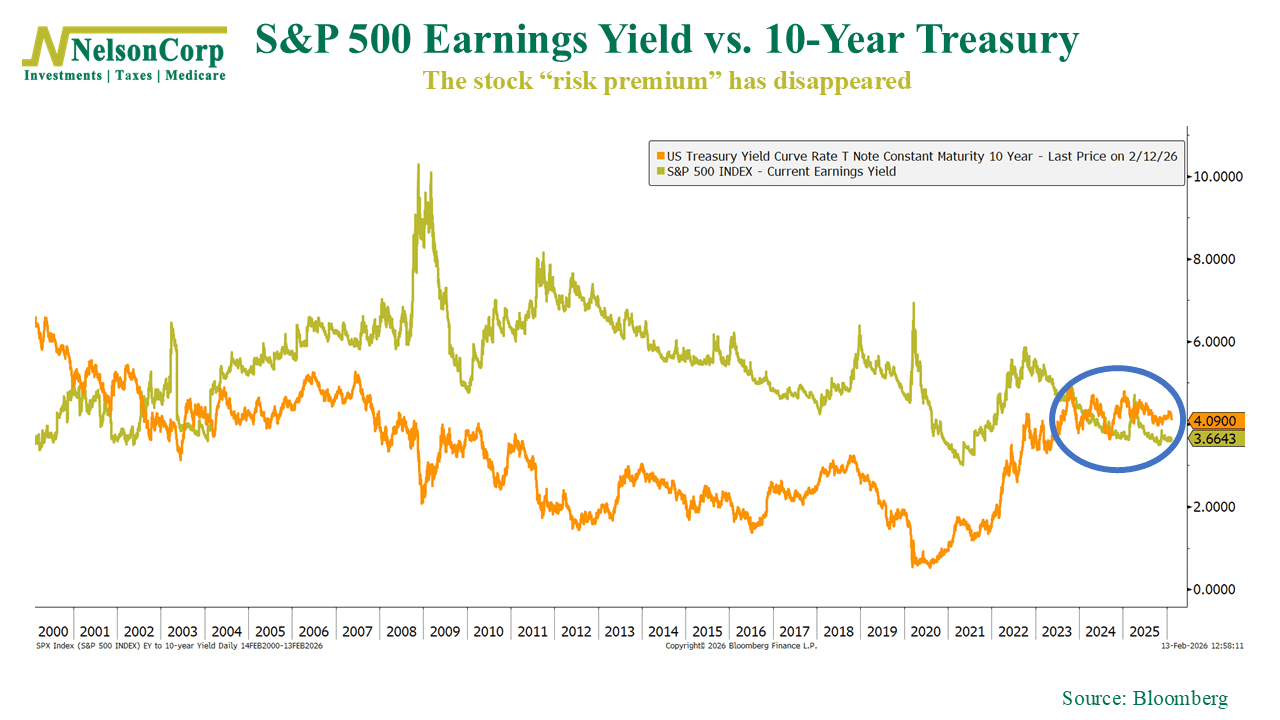
For most of history, the earnings yield on stocks was greater than that of bonds (the gold line was above the orange line). But in recent years, the spread has shrunk dramatically and has even gone negative, like it is now.
This lack of a risk premium leaves us with some interesting effects to ponder. When the earnings yield sits below Treasury yields, the market is essentially betting on continued earnings growth to justify current valuations. So far, that hasn’t been a problem for the stock market. But if growth expectations wobble, bonds can look relatively more attractive pretty quickly.
For example, the following chart shows that money flowing into bond ETFs have been trending higher for a couple of years now, coinciding with the tightening of the risk premium we just talked about.
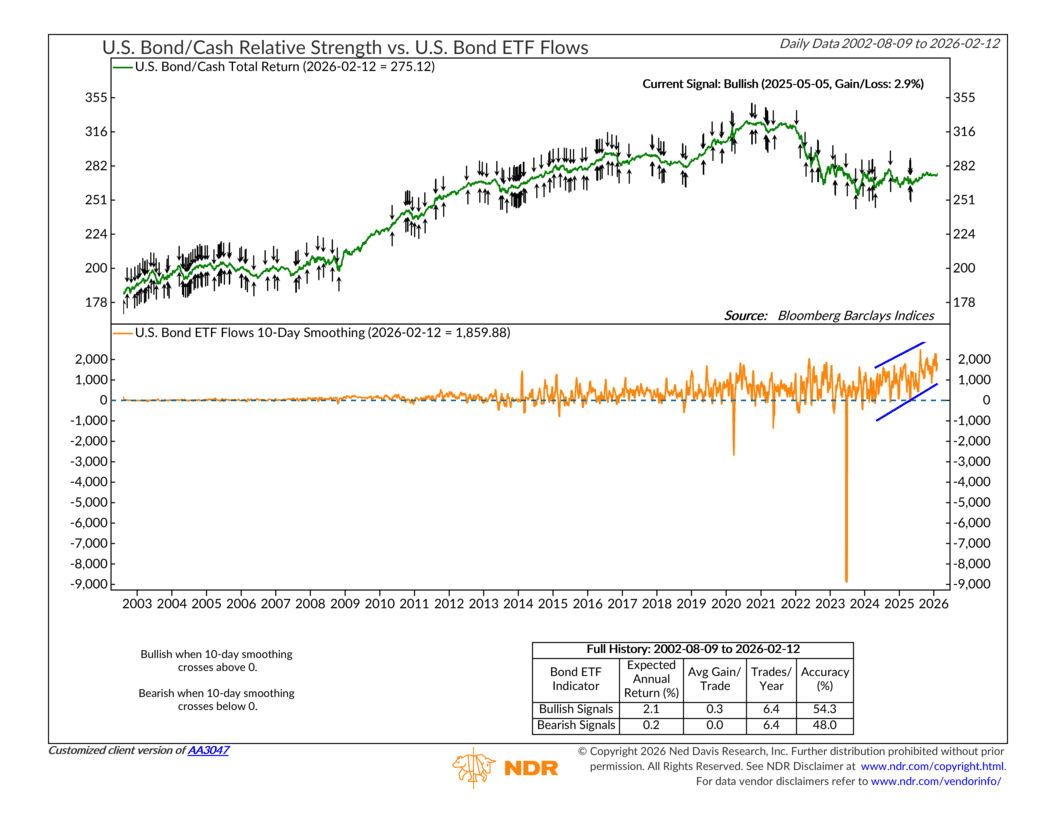
Now, to be fair, that doesn’t automatically mean stocks are in trouble. It just means that the margin for error is smaller. When the earnings yield is below the Treasury yield, stocks need growth to carry the load. Bonds, on the other hand, just need stability.
We still like stocks here. They are the true drivers of wealth creation over time. But it’s important to keep an eye on these types of dynamics as financial markets are always changing and nothing works forever without fail.
This is intended for informational purposes only and should not be used as the primary basis for an investment decision. Consult an advisor for your personal situation.
Indices mentioned are unmanaged, do not incur fees, and cannot be invested into directly.
Past performance does not guarantee future results.
The S&P 500 Index, or Standard & Poor’s 500 Index, is a market-capitalization-weighted index of 500 leading publicly traded companies in the U.S.
The Dow Jones Industrial Average (DJIA) is a price-weighted index composed of 30 widely traded blue-chip U.S. common stocks. The Nasdaq 100 Index is a basket of the 100 largest, most actively traded U.S. companies listed on the Nasdaq stock exchange. The index includes companies from various industries except for the financial industry, like commercial and investment banks. The Russell 3000 Index is a capitalization-weighted stock market index that seeks to be a benchmark of the entire U.S. stock market. The S&P MidCap 400 is designed to measure the performance of 400 mid-sized companies, reflecting the distinctive risk and return characteristics of this market segment. S&P 600 Index measures the small-cap segment of the U.S. equity market. The index is designed to track companies that meet specific inclusion criteria to ensure that they are liquid and financially viable. The S&P 100 index is a capitalization-weighted index based on 100 highly capitalized stocks for which options are listed on the CBOE (Chicago Board of Exchange). The MSCI EAFE Index is an equity index which captures large and mid cap representation across 21 Developed Markets countries* around the world, excluding the US and Canada.
The Bloomberg U.S. Corporate Bond Index measures the investment grade, fixed-rate, taxable corporate bond market. The Bloomberg U.S. Corporate High Yield Index is comprised of domestic and corporate bonds rated Ba and below with a minimum outstanding amount of $150 million. The Bloomberg U.S. Municipal Index covers the USD-denominated long-term tax exempt bond market. The index has four main sectors: state and local general obligation bonds, revenue bonds, insured bonds and prerefunded bonds.