OVERVIEW
Markets finished the week on firmer footing, with broad participation across most asset classes. The S&P 500 gained 1.07%, the Dow Jones Industrials rose 0.25%, and the NASDAQ added 1.51%. Large-cap stocks participated as well, with the S&P 100 up 1.18% for the week.
Under the surface, leadership remains skewed toward value and smaller-cap stocks. The Russell 3000 rose 1.08%, with Growth up 1.49% on the week but still down 3.73% year to date. Value gained 0.66% and continues to lead in 2026, now up 7.29%. Mid- and small-caps remain standouts, with the S&P 400 up 1.22% and the S&P 600 higher by 0.50% last week. Both are up more than 9% year to date, reflecting improving breadth beyond mega-cap names.
International markets continue to quietly lead. Developed markets (EAFE) climbed 0.80%, while emerging markets added 0.78%. Emerging markets are now up 11.60% in 2026, outpacing most U.S. benchmarks. The U.S. dollar rose 1.01% on the week, a potential headwind for overseas returns going forward.
Fixed income was mixed. Short-term Treasuries were flat to slightly positive, while intermediate- and long-term Treasuries slipped modestly. Credit-sensitive areas held up better, with investment-grade and high-yield bonds posting small gains. Overall, bonds remain positive year to date, though leadership within fixed income has narrowed.
Real assets continued to show strength. Commodities rose 2.00%, oil surged 6.07% on the week and is now up nearly 17% year to date, and gold gained 0.69%, pushing its 2026 advance above 17%. MLPs added 0.73% and remain one of the strongest areas of the market this year. Real estate also moved higher, up 0.31% for the week. Meanwhile, the VIX fell 7.33%, suggesting volatility pressures eased as risk appetite improved.
KEY CONSIDERATIONS
The Highs and the Lows – Rotation has been the word on the tip of everyone’s tongue to start the year. It’s interesting because rotation basically means change is happening under the surface of financial markets. Sure, the major U.S. stock indices, like the S&P 500 Index, are only a percent or two off all-time highs, but the stocks within the index are making a lot of noise.
For example, here is a fascinating chart from Bespoke Investment Group showing the percentage of overbought and oversold stocks in the S&P 500. Overbought simply means a stock is more than one standard deviation above its 50-day moving average. Oversold is the opposite. Normally, those two lines move in opposite directions. If more stocks are overbought, fewer should be oversold.
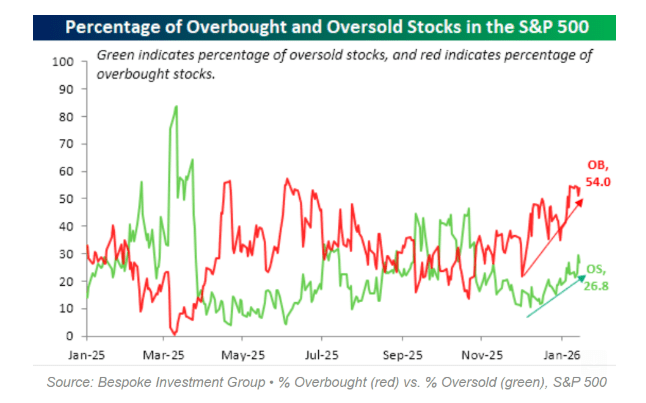
That is not what is happening now.
Both are rising at the same time, and they are rising quickly. Since 2007, this has only happened 13 times when both overbought and oversold readings jumped by at least 10 percentage points in a single month.
We have an indicator that shows something similar. It’s called the High-Low Logic Index, and it tracks whether the market is “out of gear” based on the lesser of new highs or new lows traded on the stock market. I know that sounds a bit confusing, but all you really need to know is that when the indicator jumps to a high level, like it is now, it means there are a lot of stocks hitting new highs at the same time a bunch of stocks are hitting new lows.
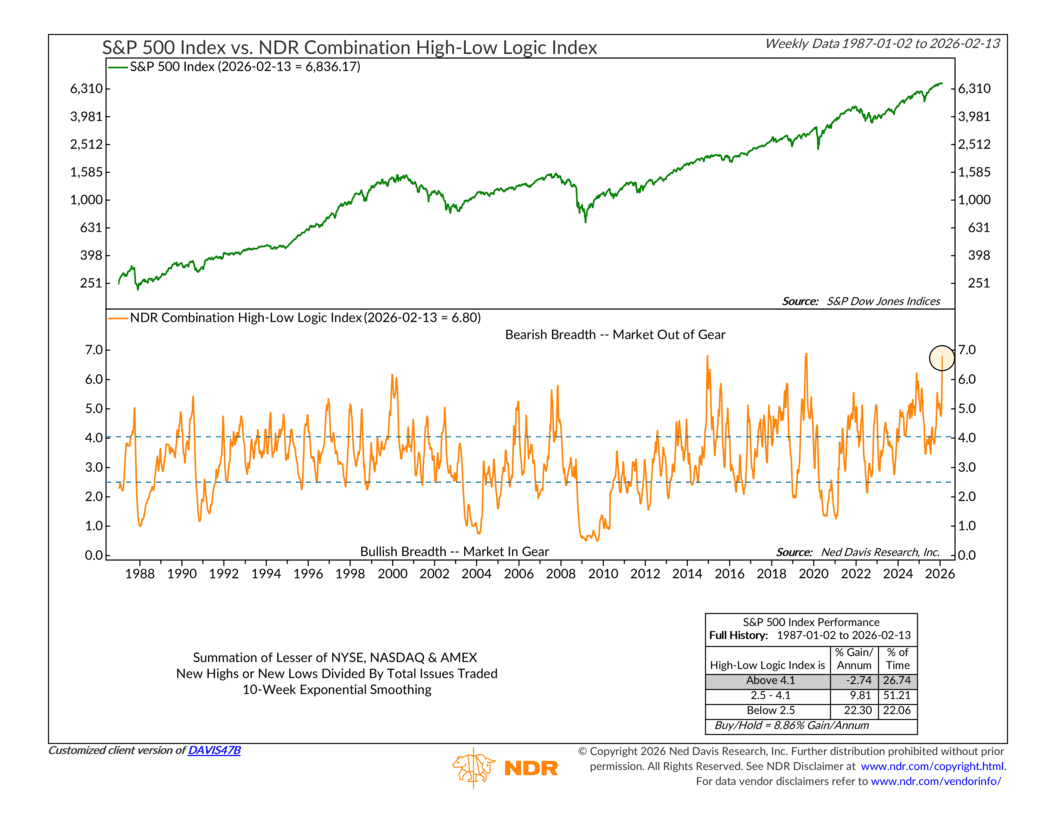
In other words, despite a lot of 52-week highs recently, which is bullish, there were over 100 weekly new lows for the third consecutive week last week. This pushed the High-Low Logic Index so far into negative territory that it is hard to ignore. That should at least moderate some bullish conviction.
But with that said, at the end of the day, the broader market indexes do appear to be holding up, for now. For example, our trusty old 85-day Stochastic Indicator, which tracks the stock market’s momentum, remains well above its upper bracket lines, which would trigger a sell signal if it fell through them.
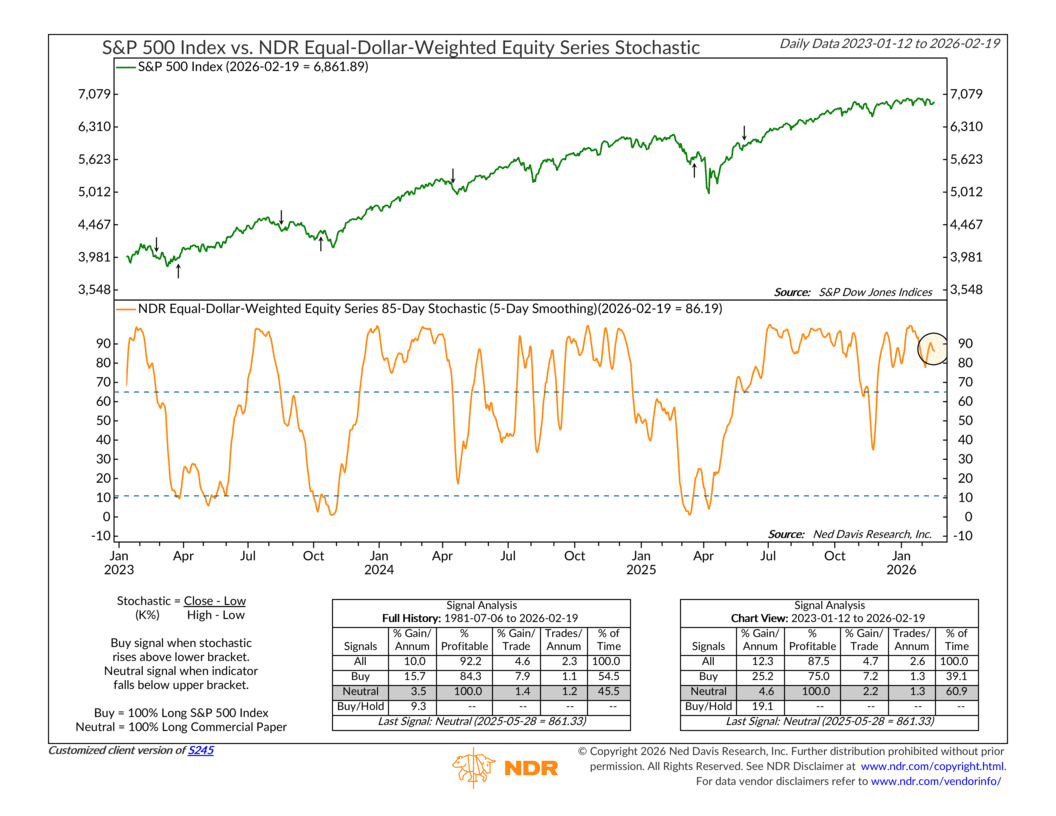
So this is one of those moments where the message is mixed. Internals are flashing caution. But price and momentum, at least for now, are holding firm.
For investors, the takeaway is not to panic but to pay attention. When markets get noisy under the surface, risk management becomes more important. Broad diversification, disciplined position sizing, and awareness of trend can help navigate periods like this.
This is intended for informational purposes only and should not be used as the primary basis for an investment decision. Consult an advisor for your personal situation.
Indices mentioned are unmanaged, do not incur fees, and cannot be invested into directly.
Past performance does not guarantee future results.
The S&P 500 Index, or Standard & Poor’s 500 Index, is a market-capitalization-weighted index of 500 leading publicly traded companies in the U.S.
The Dow Jones Industrial Average (DJIA) is a price-weighted index composed of 30 widely traded blue-chip U.S. common stocks. The Nasdaq 100 Index is a basket of the 100 largest, most actively traded U.S. companies listed on the Nasdaq stock exchange. The index includes companies from various industries except for the financial industry, like commercial and investment banks. The Russell 3000 Index is a capitalization-weighted stock market index that seeks to be a benchmark of the entire U.S. stock market. The S&P MidCap 400 is designed to measure the performance of 400 mid-sized companies, reflecting the distinctive risk and return characteristics of this market segment. S&P 600 Index measures the small-cap segment of the U.S. equity market. The index is designed to track companies that meet specific inclusion criteria to ensure that they are liquid and financially viable. The S&P 100 index is a capitalization-weighted index based on 100 highly capitalized stocks for which options are listed on the CBOE (Chicago Board of Exchange). The MSCI EAFE Index is an equity index which captures large and mid cap representation across 21 Developed Markets countries* around the world, excluding the US and Canada.
The Bloomberg U.S. Corporate Bond Index measures the investment grade, fixed-rate, taxable corporate bond market. The Bloomberg U.S. Corporate High Yield Index is comprised of domestic and corporate bonds rated Ba and below with a minimum outstanding amount of $150 million. The Bloomberg U.S. Municipal Index covers the USD-denominated long-term tax exempt bond market. The index has four main sectors: state and local general obligation bonds, revenue bonds, insured bonds and prerefunded bonds.