OVERVIEW
KEY CONSIDERATIONS
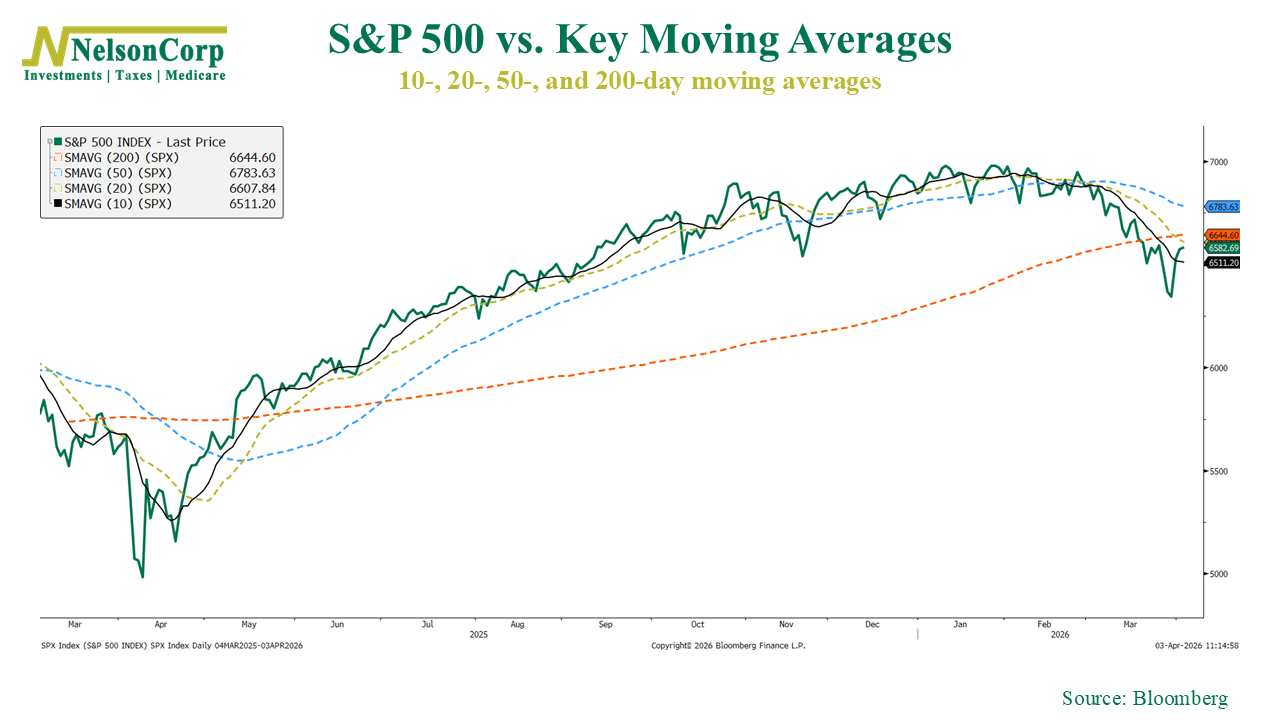
A Fragile Bounce – The stock market bounced back a bit last week. In what you might call a “counter-trend” rally, the S&P 500 managed to climb back above its 10-day moving average. However, as you can see below, it still remains below its 20-, 50-, and 200-day moving averages, so we’re not declaring an all-clear just yet.
Within our models, the main source of tension continues to be an area the market has been sensitive to for some time now, inflation. The biggest shift came from the ISM Manufacturing Prices Paid Index, which moved into sell territory with a reading of 78.30. Anything above 50 indicates manufacturers are paying higher prices for inputs, so a reading near 80 suggests those costs are rising quickly.
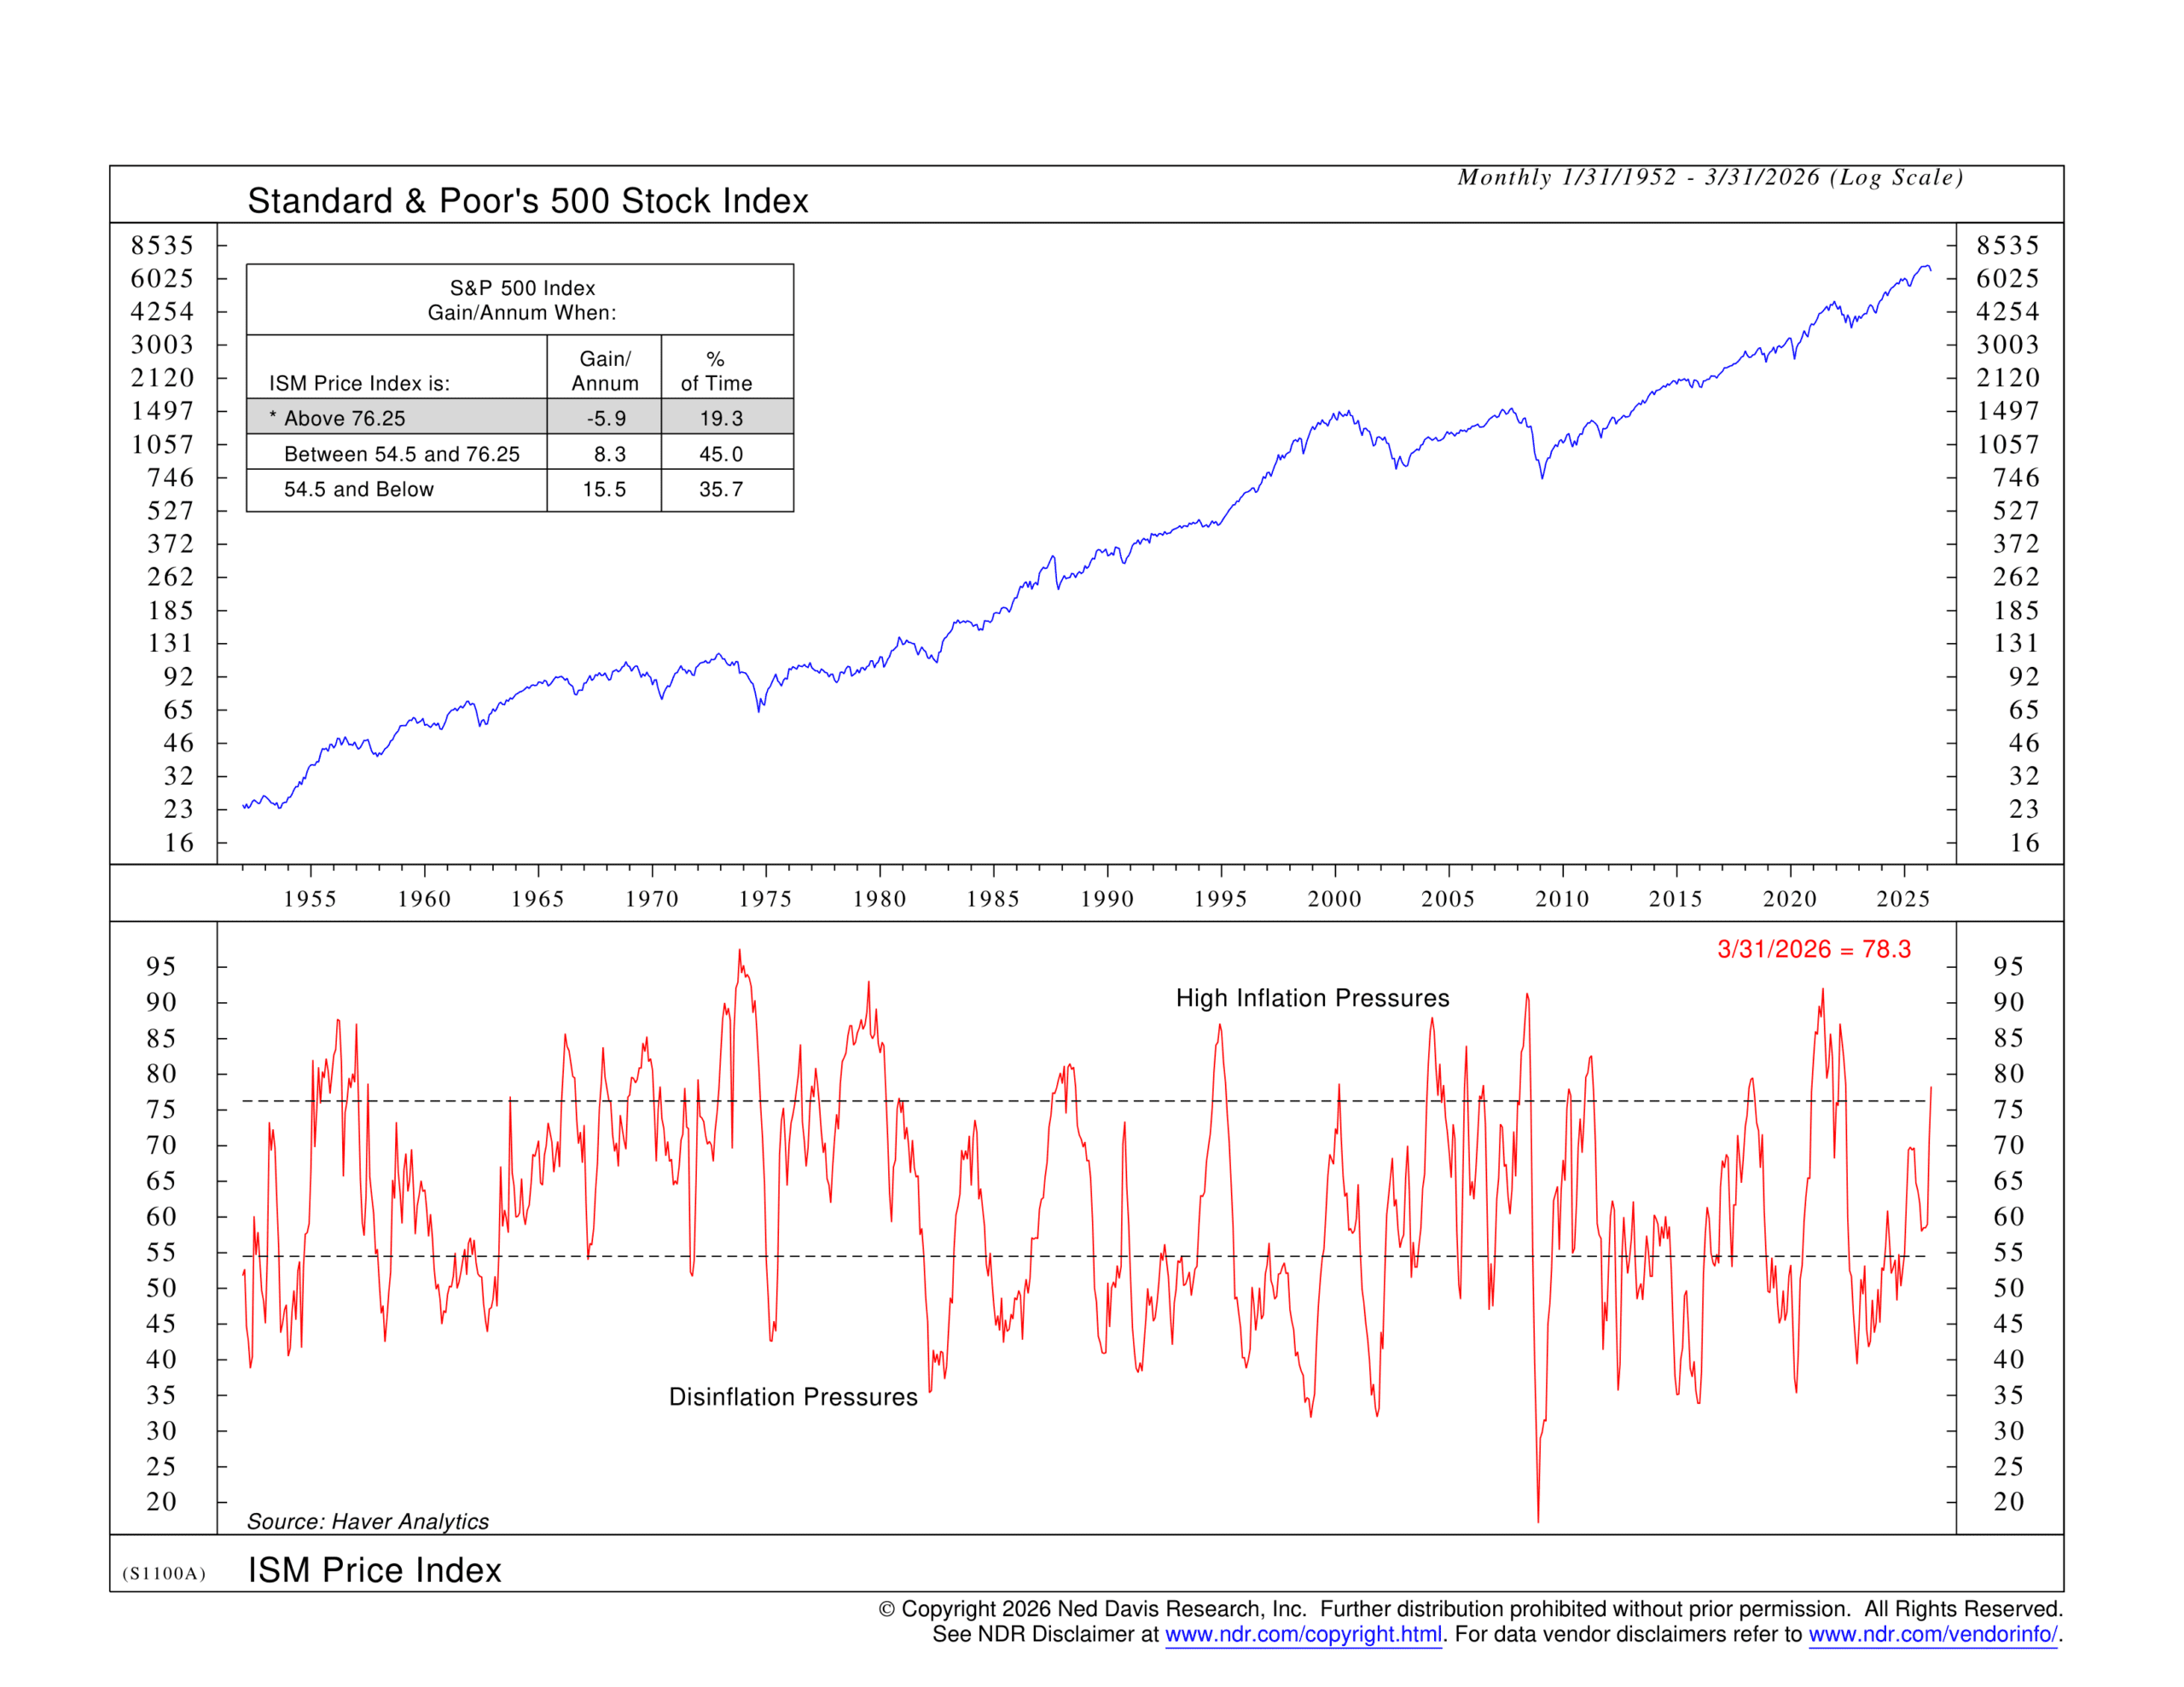
That’s not something stocks tend to like. Elevated or “sticky” inflation can limit the Federal Reserve’s flexibility when it comes to setting interest rates. The worst-case scenario for the Fed is an environment of slowing growth alongside persistent inflation. Stocks hate that.
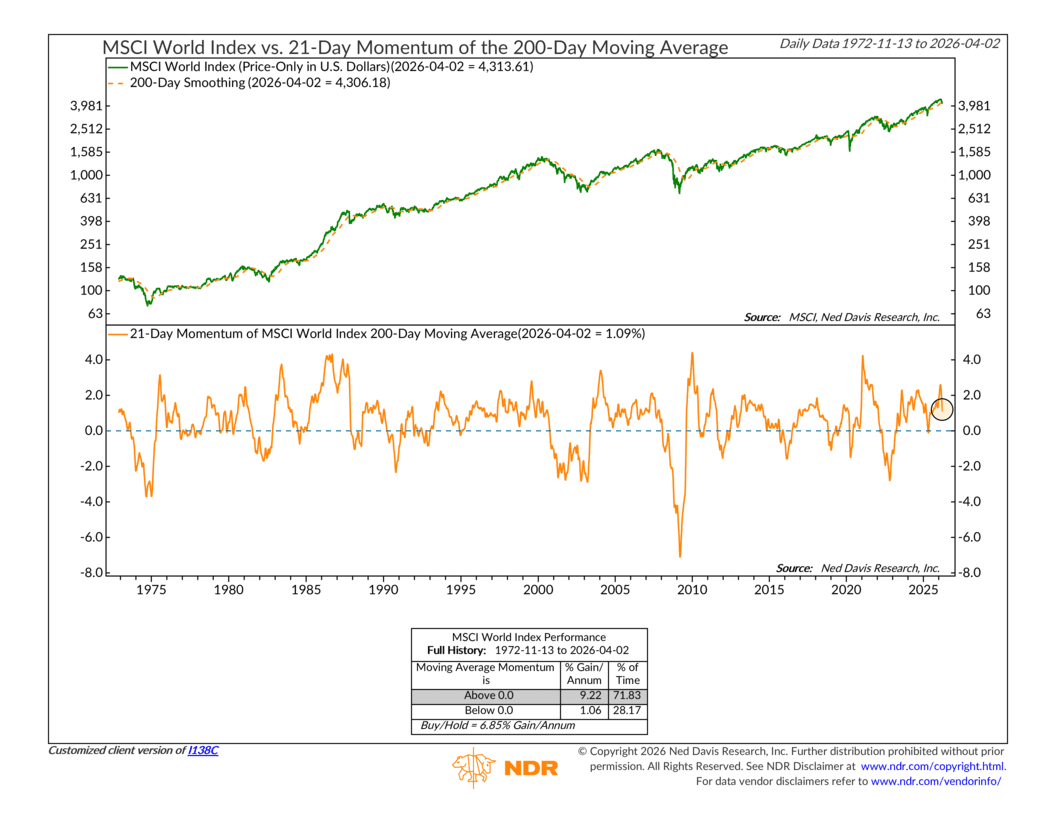
At the same time, though, there are still some encouraging signs in the model. When you step back and look at the long-term trend of global equity markets, it’s being tested, but it hasn’t broken.
For example, the 21-day momentum of the MSCI World’s 200-day moving average remains slightly positive, and the index itself is still holding just above its long-term trend line. When this measure stays positive, global equities have generally delivered solid long-term returns, which makes this an important area to watch.
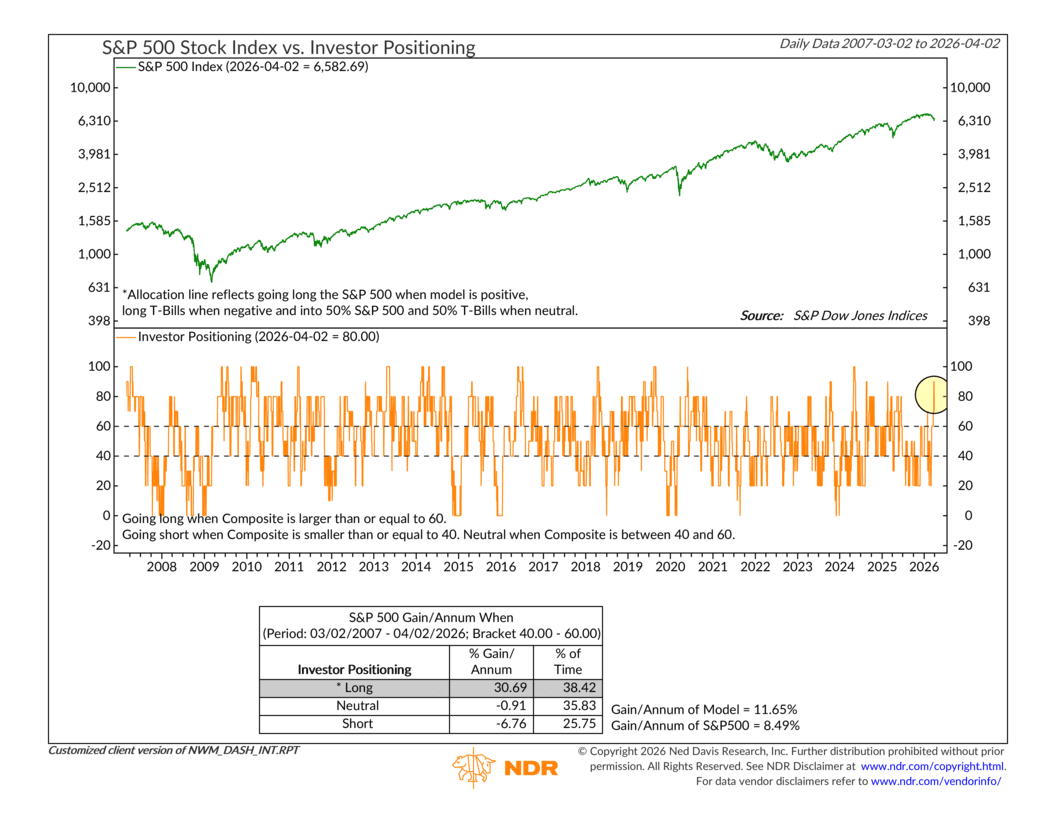
Investor behavior is also telling an interesting story. Positioning, in particular, has shifted towards a more defensive direction, with many of the indicators now sitting in buy territory on a contrarian basis. In plain terms, investors have moved more toward cash and bonds, and overall sentiment is cautious. Historically, that type of environment has often laid the groundwork for better forward returns, simply because much of the selling pressure has already occured. But for that to play out, you typically need improving conditions alongside it, not just pessimism on its own.
Put it all together, and the picture remains mixed, with a bit of a tug-of-war beneath the surface. Inflation is starting to look like a potential headwind again, and it’s something the market can’t ignore. At the same time, the broader global trend hasn’t rolled over, but it isn’t gaining much strength either. Participation in the recent price action still looks somewhat limited, which suggests momentum isn’t fully there yet.
The key from here will be whether inflation begins to stabilize. A big part of that will come down to how the situation in the Middle East evolves and whether oil prices start to settle down. If those pressures ease and participation begins to broaden, the market could respond quickly. For now, we’re watching closely and letting the data guide the next move.
This is intended for informational purposes only and should not be used as the primary basis for an investment decision. Consult an advisor for your personal situation.
Indices mentioned are unmanaged, do not incur fees, and cannot be invested into directly.
Past performance does not guarantee future results.
The S&P 500 Index, or Standard & Poor’s 500 Index, is a market-capitalization-weighted index of 500 leading publicly traded companies in the U.S.
The Dow Jones Industrial Average (DJIA) is a price-weighted index composed of 30 widely traded blue-chip U.S. common stocks. The Nasdaq 100 Index is a basket of the 100 largest, most actively traded U.S. companies listed on the Nasdaq stock exchange. The index includes companies from various industries except for the financial industry, like commercial and investment banks. The Russell 3000 Index is a capitalization-weighted stock market index that seeks to be a benchmark of the entire U.S. stock market. The S&P MidCap 400 is designed to measure the performance of 400 mid-sized companies, reflecting the distinctive risk and return characteristics of this market segment. S&P 600 Index measures the small-cap segment of the U.S. equity market. The index is designed to track companies that meet specific inclusion criteria to ensure that they are liquid and financially viable. The S&P 100 index is a capitalization-weighted index based on 100 highly capitalized stocks for which options are listed on the CBOE (Chicago Board of Exchange). The MSCI EAFE Index is an equity index which captures large and mid cap representation across 21 Developed Markets countries* around the world, excluding the US and Canada.
The Bloomberg U.S. Corporate Bond Index measures the investment grade, fixed-rate, taxable corporate bond market. The Bloomberg U.S. Corporate High Yield Index is comprised of domestic and corporate bonds rated Ba and below with a minimum outstanding amount of $150 million. The Bloomberg U.S. Municipal Index covers the USD-denominated long-term tax exempt bond market. The index has four main sectors: state and local general obligation bonds, revenue bonds, insured bonds and prerefunded bonds.