OVERVIEW
KEY CONSIDERATIONS
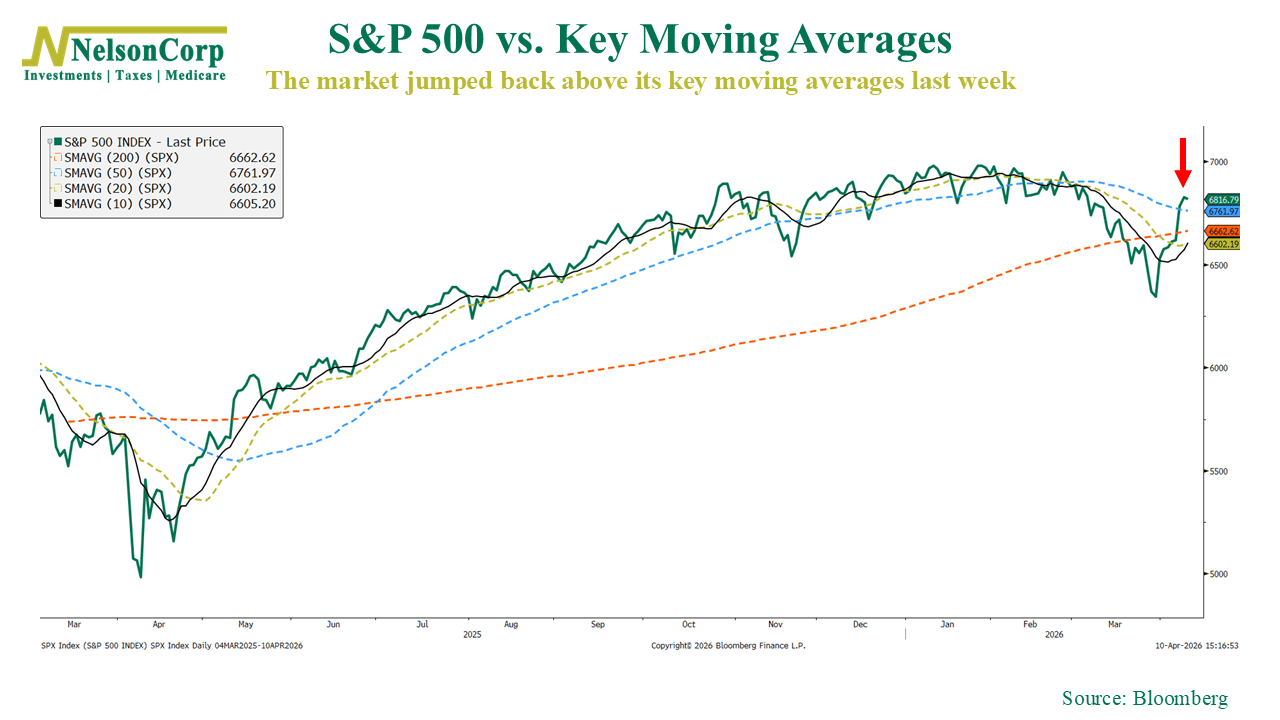
High Octane – It was another “high-octane” week on Wall Street.
First came the U.S. and Iran two-week ceasefire agreement earlier in the week. That sent oil prices plunging more than 15% in a single session. As a result, the Dow had its best daily return in over a year, and the S&P 500 surged all the way back above its key moving averages.
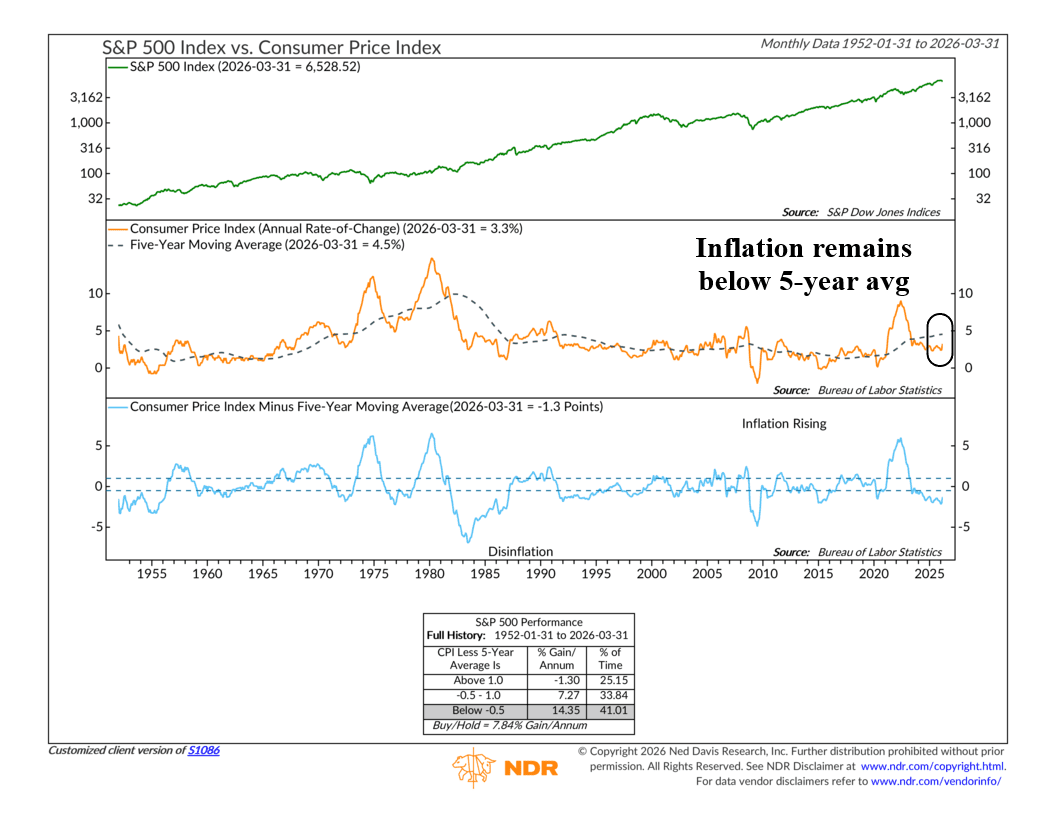
But then Friday delivered some more concerning news. The March inflation report came in hotter than expected—at about 3.3% year-over-year. Rising gasoline costs were the primary culprit.
At first glance, that seems like a pretty big deal. And it is. But from a markets perspective, it likely won’t become a problem for stocks until the annual rate of change in the CPI (currently 3.3%) rises above its 5-year average, which is about 4.5%. As the indicator below shows, stocks can do quite well if the current rate of inflation stays below the 5-year average, which is still the case today.
As for the technical side of things, the ceasefire rally had some strong effects on our models.
For example, it triggered what we call a “breadth thrust.” Shown below, this is when the percentage of global stock markets trading above their 10-day moving averages climbs above roughly 96%.
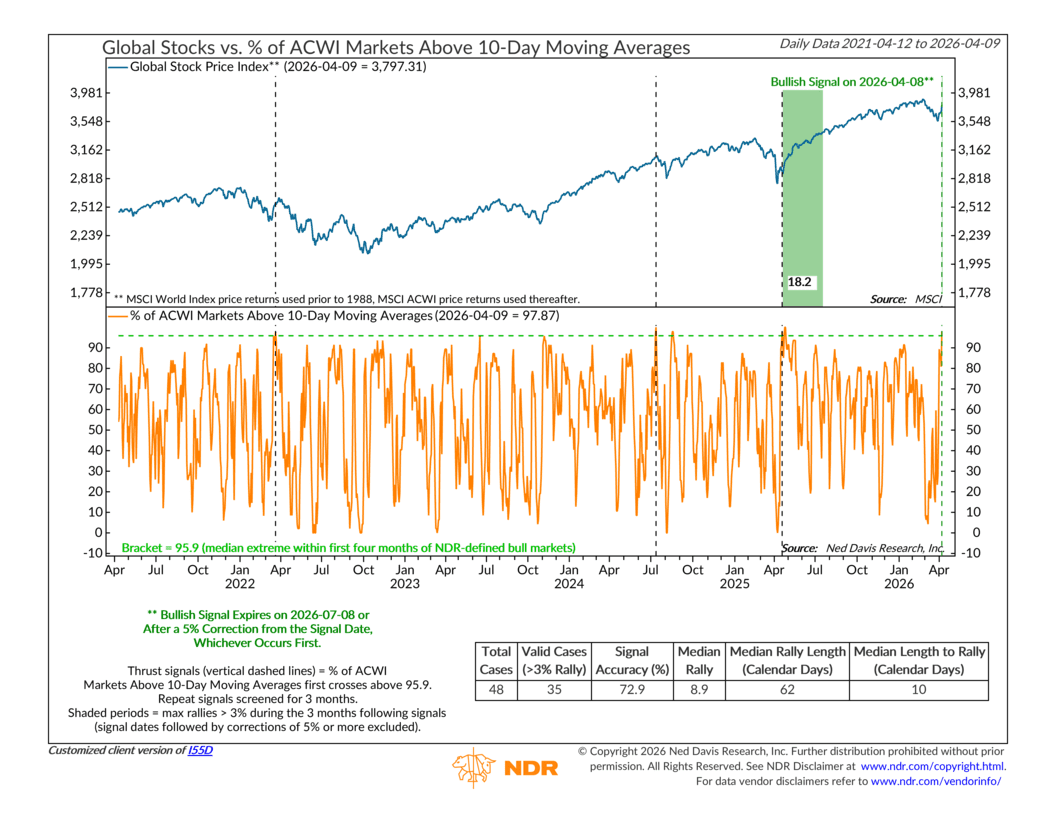
As you can see from the performance box on the indicator, powerful thrusts like this can produce pretty strong returns over the next few months, so this is definitely a good sign!
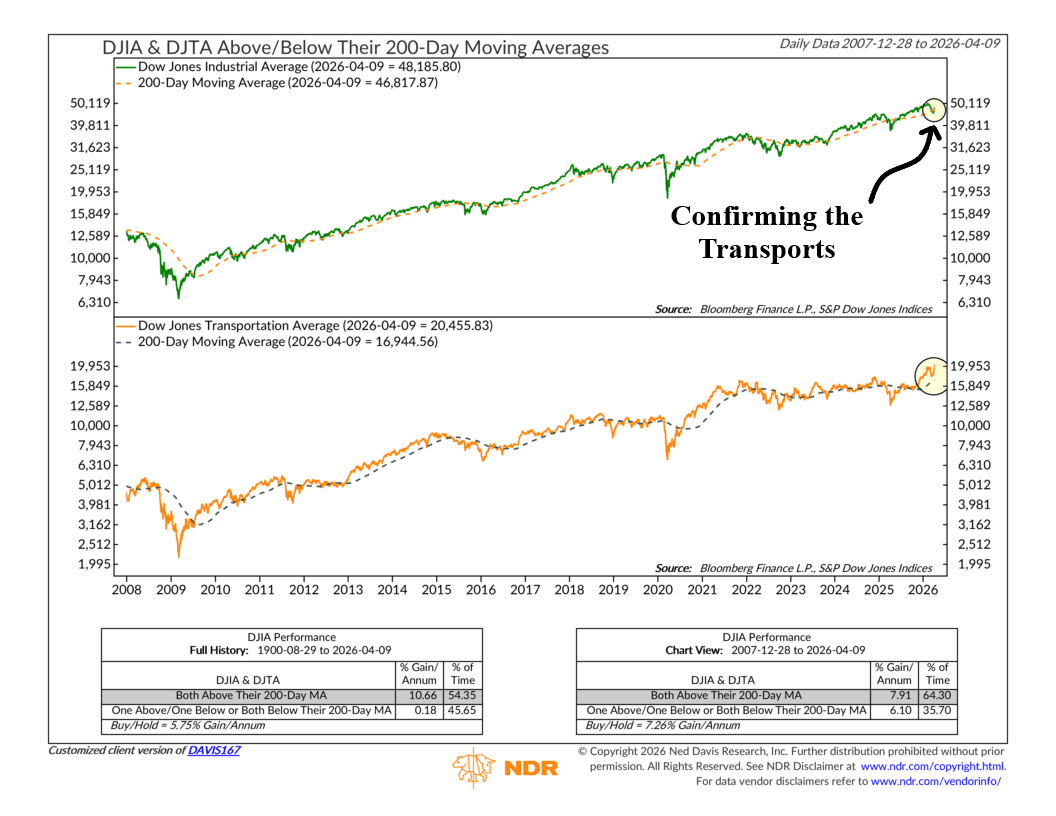
We also saw the Dow Jones Industrial Average join the Dow Jones Transportation Average when it crossed back above its 200-day moving average last week. This is the so-called “Dow Theory.” When both averages are confirming each other, it tends to be a sign of renewed market health.
Taken together, it’s a bit of a mixed picture—but one that might be starting to lean more constructive again.
On one hand, inflation remains something to watch. It hasn’t gone away, and if it continues to trend higher, it could start to pressure both the Fed and equity markets. But for now, it’s still sitting below that key threshold where it has historically caused problems.
On the other hand, the market is showing some encouraging signs under the surface. A breadth thrust, somewhat improving participation, and confirmation from Dow Theory all point to a market that’s trying to regain its footing after a choppy stretch.
The bottom line? The headlines may feel noisy, but the weight of the evidence might finally be shifting ever more positive again.
This is intended for informational purposes only and should not be used as the primary basis for an investment decision. Consult an advisor for your personal situation.
Indices mentioned are unmanaged, do not incur fees, and cannot be invested into directly.
Past performance does not guarantee future results.
The S&P 500 Index, or Standard & Poor’s 500 Index, is a market-capitalization-weighted index of 500 leading publicly traded companies in the U.S.
The Dow Jones Industrial Average (DJIA) is a price-weighted index composed of 30 widely traded blue-chip U.S. common stocks. The Nasdaq 100 Index is a basket of the 100 largest, most actively traded U.S. companies listed on the Nasdaq stock exchange. The index includes companies from various industries except for the financial industry, like commercial and investment banks. The Russell 3000 Index is a capitalization-weighted stock market index that seeks to be a benchmark of the entire U.S. stock market. The S&P MidCap 400 is designed to measure the performance of 400 mid-sized companies, reflecting the distinctive risk and return characteristics of this market segment. S&P 600 Index measures the small-cap segment of the U.S. equity market. The index is designed to track companies that meet specific inclusion criteria to ensure that they are liquid and financially viable. The S&P 100 index is a capitalization-weighted index based on 100 highly capitalized stocks for which options are listed on the CBOE (Chicago Board of Exchange). The MSCI EAFE Index is an equity index which captures large and mid cap representation across 21 Developed Markets countries* around the world, excluding the US and Canada.
The Bloomberg U.S. Corporate Bond Index measures the investment grade, fixed-rate, taxable corporate bond market. The Bloomberg U.S. Corporate High Yield Index is comprised of domestic and corporate bonds rated Ba and below with a minimum outstanding amount of $150 million. The Bloomberg U.S. Municipal Index covers the USD-denominated long-term tax exempt bond market. The index has four main sectors: state and local general obligation bonds, revenue bonds, insured bonds and prerefunded bonds.