OVERVIEW
KEY CONSIDERATIONS
Let’s Get Technical – Investors have had plenty to digest lately. Inflation has started to get worse again. Central banks are also becoming more hawkish as a result. Oh, and stocks finally experienced a meaningful pullback earlier this month after a strong recent run.
Now, when markets become more volatile, it’s easy to get caught up in the daily headlines. But one of the things we like to do is step back and look at what the market itself is telling us.
That’s where technical indicators can be helpful.
While fundamentals tell us what we should own over the long run, technical indicators help us understand what investors are actually doing with their money today. They can provide valuable clues about the health of a market trend and whether buyers or sellers remain in control.
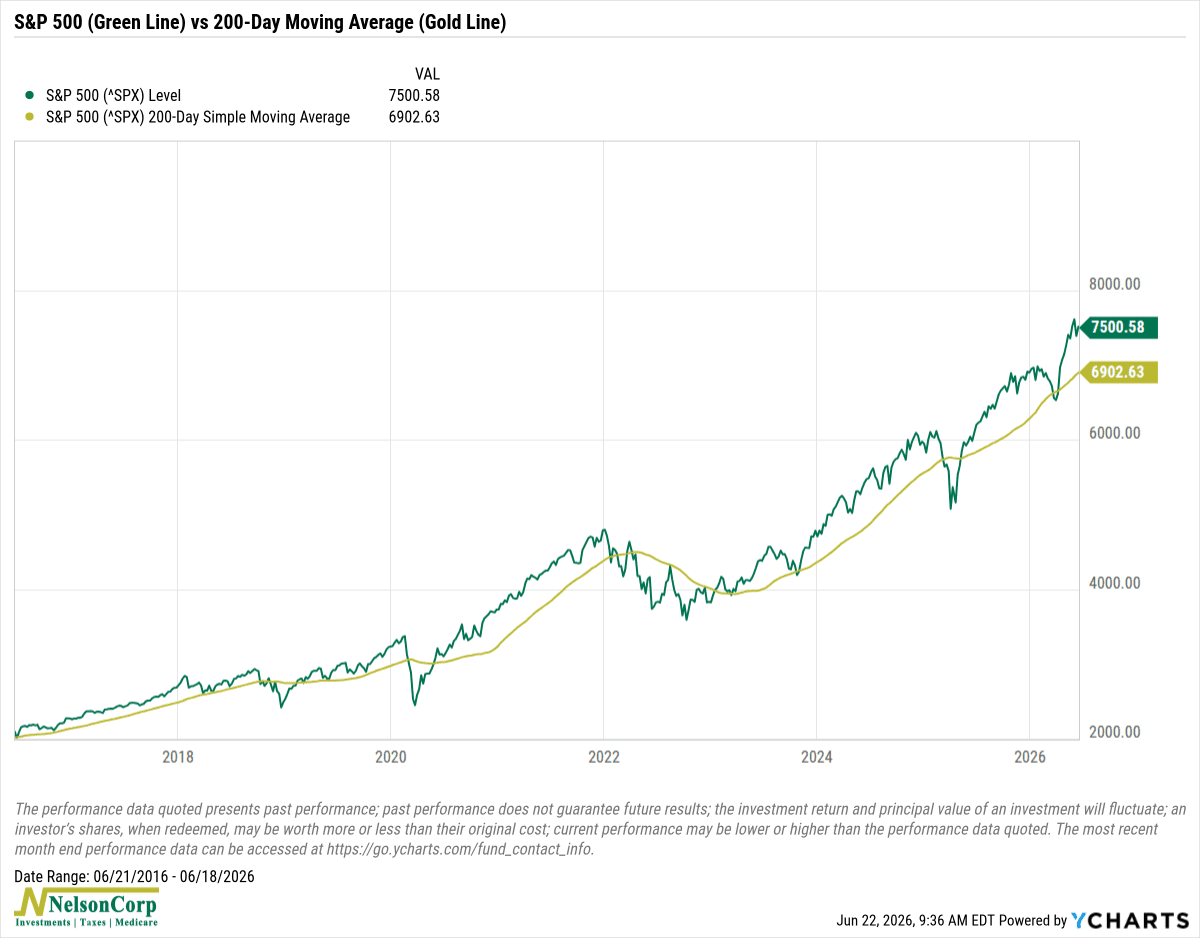
One of the most widely followed indicators is the 200-day moving average. Think of it as a long-term trend line. Historically, when the S&P 500 trades above its 200-day moving average, the market has tended to experience stronger returns than when it falls below that level.
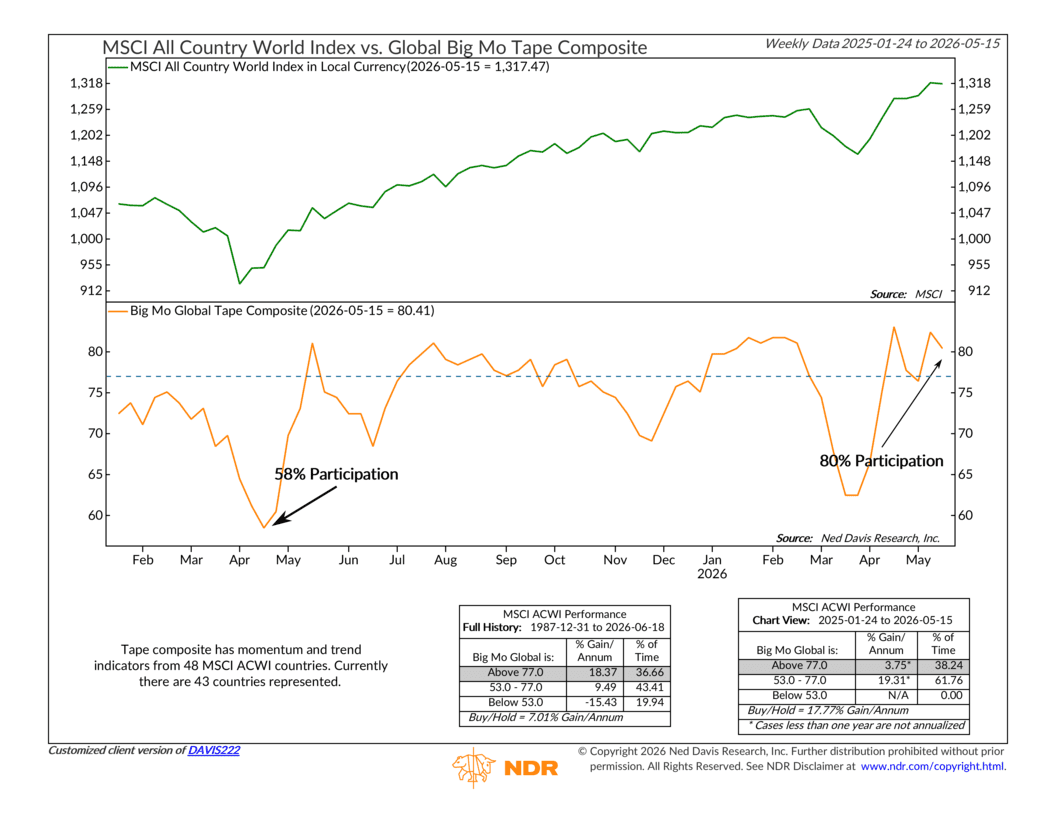
Another indicator we monitor is market breadth, which measures how many stocks are participating in a move. Healthy bull markets typically involve broad participation across sectors and industries. When only a handful of stocks are carrying the market higher, that can be a warning sign. Today, while leadership remains concentrated in some areas, participation has improved significantly from where it stood a year ago.
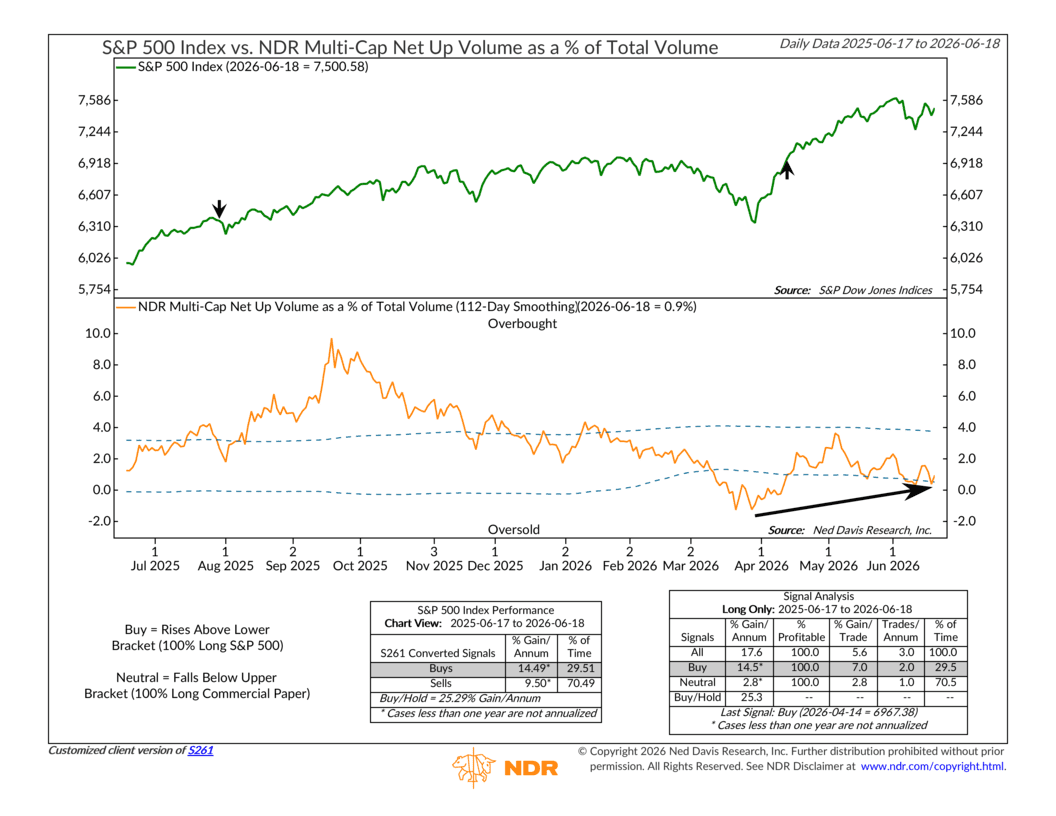
Volume can also provide important clues. Strong rallies are often accompanied by strong buying volume, while sharp declines driven by panic selling tend to show up in unusually heavy trading activity. Watching how investors respond during pullbacks can tell us a lot about the conviction behind the trend.
The good news is that despite recent volatility, many longer-term technical measures remain constructive. The market has pulled back a bit, but most major indexes continue to trade above their long-term trend lines, and breadth remains healthier than it was during much of 2024 and early 2025.
Bottom line: Markets rarely move in a straight line. Pullbacks and periods of uncertainty are a normal part of investing. While fundamentals remain the primary driver of long-term returns, technical indicators can help us separate normal market noise from meaningful changes in trend. For now, the evidence suggests any weakness from here will look more like a pause within an ongoing bull market than the start of something more concerning.
This is intended for informational purposes only and should not be used as the primary basis for an investment decision. Consult an advisor for your personal situation.
Indices mentioned are unmanaged, do not incur fees, and cannot be invested into directly.
Past performance does not guarantee future results.
The S&P 500 Index, or Standard & Poor’s 500 Index, is a market-capitalization-weighted index of 500 leading publicly traded companies in the U.S.
The Dow Jones Industrial Average (DJIA) is a price-weighted index composed of 30 widely traded blue-chip U.S. common stocks. The Nasdaq 100 Index is a basket of the 100 largest, most actively traded U.S. companies listed on the Nasdaq stock exchange. The index includes companies from various industries except for the financial industry, like commercial and investment banks. The Russell 3000 Index is a capitalization-weighted stock market index that seeks to be a benchmark of the entire U.S. stock market. The S&P MidCap 400 is designed to measure the performance of 400 mid-sized companies, reflecting the distinctive risk and return characteristics of this market segment. S&P 600 Index measures the small-cap segment of the U.S. equity market. The index is designed to track companies that meet specific inclusion criteria to ensure that they are liquid and financially viable. The S&P 100 index is a capitalization-weighted index based on 100 highly capitalized stocks for which options are listed on the CBOE (Chicago Board of Exchange). The MSCI EAFE Index is an equity index which captures large and mid cap representation across 21 Developed Markets countries* around the world, excluding the US and Canada.
The Bloomberg U.S. Corporate Bond Index measures the investment grade, fixed-rate, taxable corporate bond market. The Bloomberg U.S. Corporate High Yield Index is comprised of domestic and corporate bonds rated Ba and below with a minimum outstanding amount of $150 million. The Bloomberg U.S. Municipal Index covers the USD-denominated long-term tax exempt bond market. The index has four main sectors: state and local general obligation bonds, revenue bonds, insured bonds and prerefunded bonds.