
OVERVIEW
KEY CONSIDERATIONS
Square PEG, Round Hole? – It’s pretty hard to look at the stock market today and not be at least a little bit concerned about valuations. For example, the S&P 500’s forward P/E (price-to-earnings ratio) currently sits around 21. In simple terms, that means investors are paying about $21 for every $1 of expected earnings over the next year.
That’s fairly high—in a vacuum. But that number doesn’t tell us everything.
There’s this other concept in finance known as the PEG ratio. The PEG ratio simply compares the market’s forward P/E to its expected long-term earnings growth rate.
It may not sound like a big difference, but it is. We’ve gone from asking, “Is the market expensive?” to asking, “Is the market expensive relative to how fast earnings are expected to grow?”
That distinction matters.
Take a look at the first chart below. There’s a lot going on, but the key takeaway is that the S&P 500’s expected long-term earnings growth rate is currently about 14.6%. That’s well above the long-term average of roughly 12%. Plug that into the PEG ratio calculation and you get a reading of 1.45 (the second panel from the top).
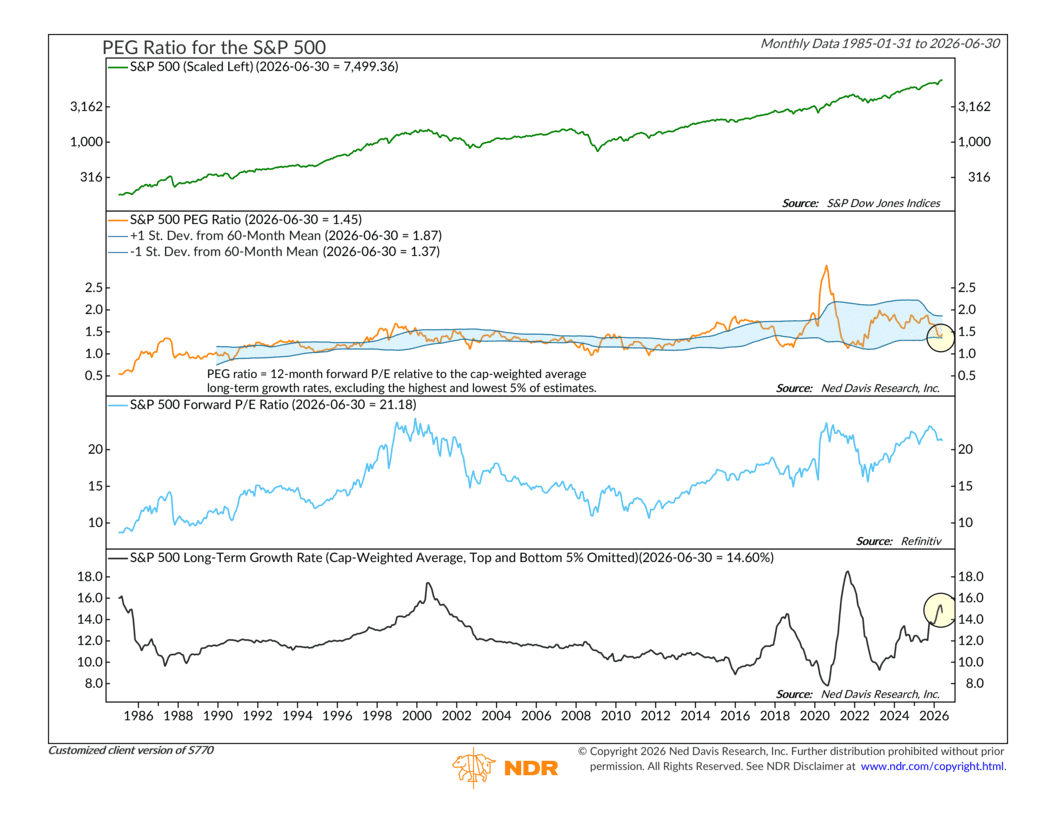
As you can see, that’s near the lower end of its historical range—a good thing. The lower the PEG ratio the better. So basically, after we adjust for expected earnings growth, the market appears much more reasonably priced.
Ok, so that’s all good and dandy. But that does lead to an obvious question: what if those expectations of growth are too optimistic?
That’s where this second chart comes in. It tracks the median expected one-year earnings growth rate for companies in the S&P 500. Historically, estimates between roughly 3% and 14% have been the sweet spot. Markets have generally performed well when expectations have fallen within that range. But once expectations climb much above 14%, subsequent returns have tended to be below average.
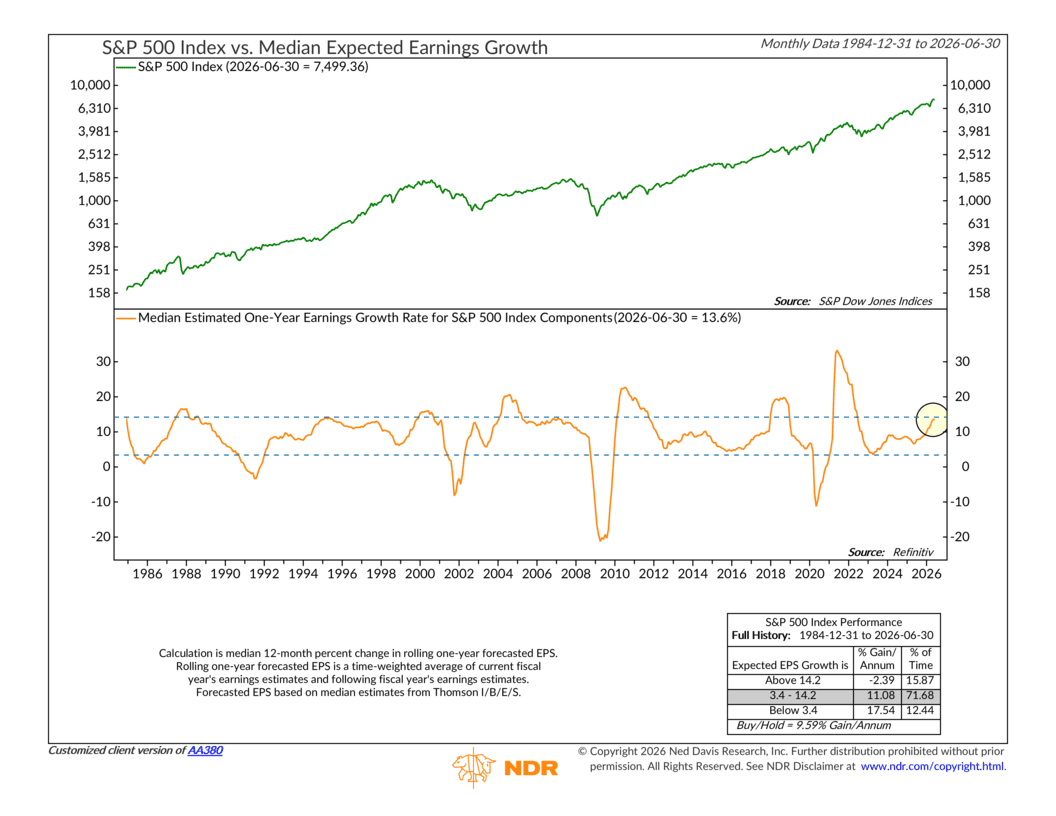
Now, just to clarify, that doesn’t necessarily mean earnings growth above 14% is impossible. More often, it reflects analysts becoming overly optimistic during strong markets. Eventually, expectations become difficult to exceed, estimates get revised lower, and stock prices adjust accordingly.
Today’s reading sits around 13.6%, just below that historical threshold. That’s encouraging, but it’s also worth watching closely. Much of today’s valuation argument rests on companies delivering the strong earnings growth investors currently expect. If those expectations continue climbing into historically optimistic territory—or if actual results fail to keep pace—the market could become much more vulnerable.
To me, that makes the next few quarters of earnings especially important. Valuations are elevated, but they’re also being supported by strong growth expectations. As long as companies continue to deliver, those valuations are easier to justify. But if expectations begin to outrun reality, the market’s margin for error becomes much smaller.
This is intended for informational purposes only and should not be used as the primary basis for an investment decision. Consult an advisor for your personal situation.
Indices mentioned are unmanaged, do not incur fees, and cannot be invested into directly.
Past performance does not guarantee future results.
The S&P 500 Index, or Standard & Poor’s 500 Index, is a market-capitalization-weighted index of 500 leading publicly traded companies in the U.S.
The Dow Jones Industrial Average (DJIA) is a price-weighted index composed of 30 widely traded blue-chip U.S. common stocks. The Nasdaq 100 Index is a basket of the 100 largest, most actively traded U.S. companies listed on the Nasdaq stock exchange. The index includes companies from various industries except for the financial industry, like commercial and investment banks. The Russell 3000 Index is a capitalization-weighted stock market index that seeks to be a benchmark of the entire U.S. stock market. The S&P MidCap 400 is designed to measure the performance of 400 mid-sized companies, reflecting the distinctive risk and return characteristics of this market segment. S&P 600 Index measures the small-cap segment of the U.S. equity market. The index is designed to track companies that meet specific inclusion criteria to ensure that they are liquid and financially viable. The S&P 100 index is a capitalization-weighted index based on 100 highly capitalized stocks for which options are listed on the CBOE (Chicago Board of Exchange). The MSCI EAFE Index is an equity index which captures large and mid cap representation across 21 Developed Markets countries* around the world, excluding the US and Canada.
The Bloomberg U.S. Corporate Bond Index measures the investment grade, fixed-rate, taxable corporate bond market. The Bloomberg U.S. Corporate High Yield Index is comprised of domestic and corporate bonds rated Ba and below with a minimum outstanding amount of $150 million. The Bloomberg U.S. Municipal Index covers the USD-denominated long-term tax exempt bond market. The index has four main sectors: state and local general obligation bonds, revenue bonds, insured bonds and prerefunded bonds.