
OVERVIEW
KEY CONSIDERATIONS
Speed Matters – The Federal Reserve hasn’t raised interest rates since the summer of 2023. Two weeks from now, it might.
That possibility hung over markets all week, starting with Fed Chair Kevin Warsh’s Jackson Hole speech two Fridays ago, where he made his priorities pretty clear: “Inflation is running above our 2 percent target. So the Fed’s predominant focus right now should be on prices.” He also described the labor market as “consistent with full employment.”
In other words, the Fed isn’t worried about jobs. It’s worried about inflation. And that leaves the door open to a rate hike.
Friday’s jobs report didn’t do anything to close it.
The U.S. economy added 162,000 jobs in August, roughly three times what economists were looking for. July, originally reported as a loss of 23,000 jobs, was revised to a gain of 21,000. The unemployment rate held at 4.1%. As the chart below shows, the six-month trend in hiring has turned back up after a soft stretch last year.
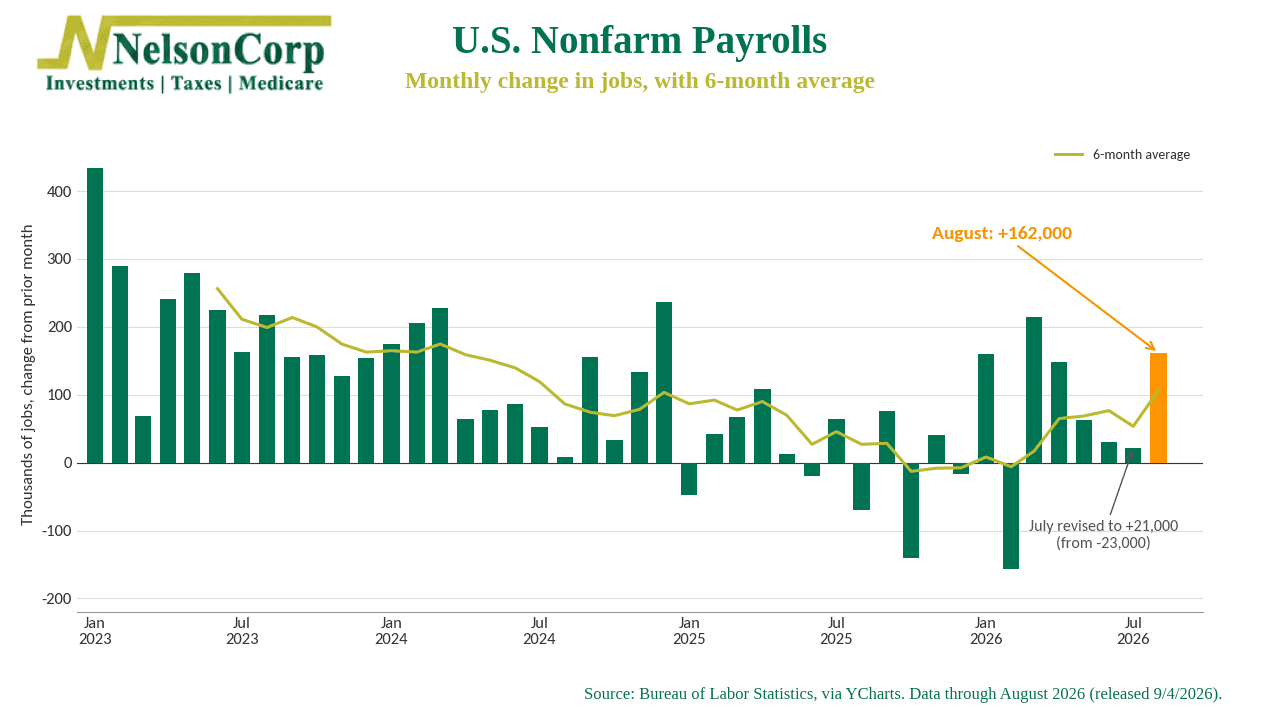
It wasn’t all strong. Wage growth slowed to 3.1% over the past year, a touch below the inflation rate. But on balance, this was a report that says the economy is holding up just fine, and that gives the Fed room to act. Markets read it that way: Treasury yields rose, stocks slipped, and the odds of a September hike moved back above 50%.
The bond market has been leaning this way for a while. As we discussed in this week’s Chart of the Week, the 2-year Treasury yield now sits well above the fed funds rate, and the 10-year yield touched nearly 4.8% on Tuesday, its highest level since October 2023.
We can see the same message in fed funds futures. The chart below tracks the gap between where futures say the fed funds rate will be in three months and where it is today. Above 25 basis points, investors are pricing in a full rate hike. When I highlighted this indicator a few weeks ago, the reading was 16 basis points. As of Thursday, it was 26.
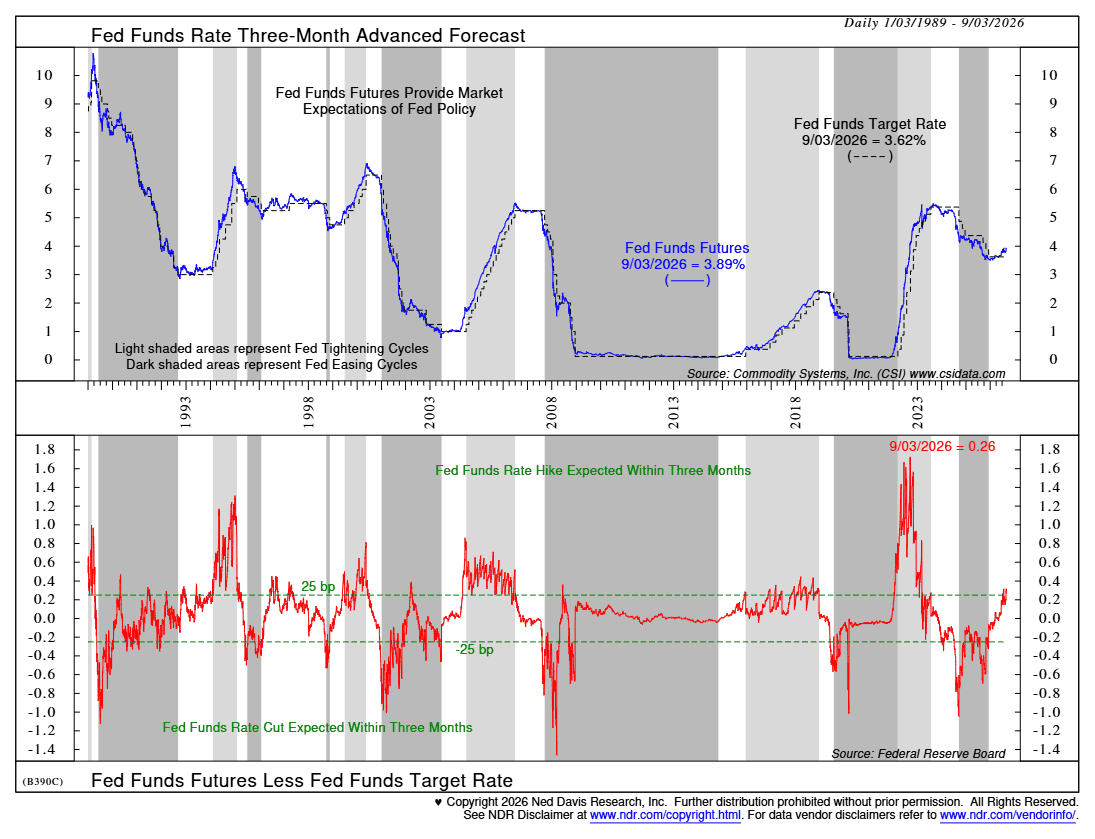
So, the market now expects a hike. Should investors be worried about that?
Well, this is where history offers some perspective. The final chart below shows how the S&P 500 has performed around the first Fed rate hike going back to 1946. But it doesn’t lump every hike together. It sorts them by speed.
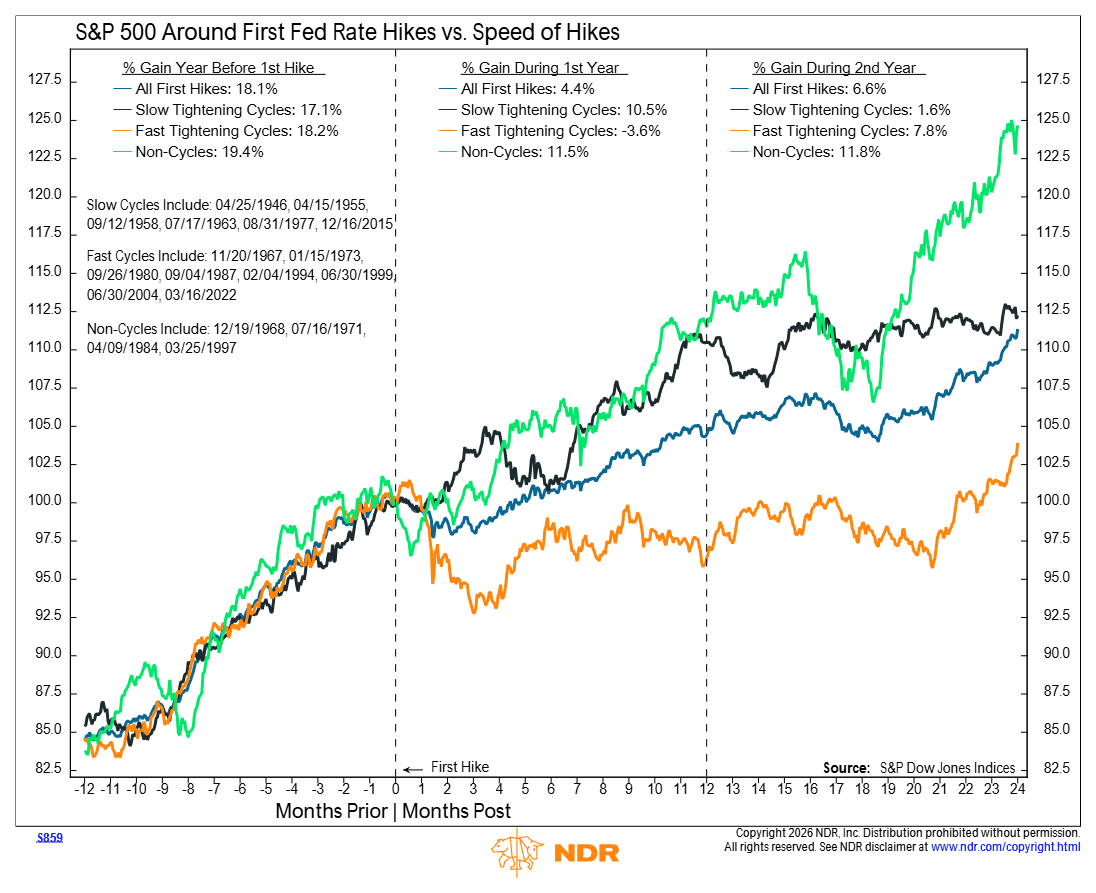
In “slow” tightening cycles, where the Fed raised rates less often than every other meeting, the S&P 500 gained 10.5% on average in the year after the first hike. In “non-cycles,” where the Fed hiked once or twice and then stopped, it gained 11.5%. But in “fast” cycles, where the Fed hiked more often than every other meeting, the S&P 500 fell 3.6% over the following year.
That’s the key takeaway. The first hike itself hasn’t been the problem. What has mattered is what came after it.
A September hike would probably be a short-term negative for stocks (notice how the market has often stumbled in the weeks right after a first hike), but it shouldn’t derail the bull market unless it turns into a full-blown tightening cycle.
Now, there’s a caveat. The reason the Fed is even having this conversation is that the economy is running hot. As we noted in this week’s Indicator Insights, real S&P 500 sales growth is pushing up against levels that have historically been “too much of a good thing,” and inflation is still above 3%. If that picture doesn’t cool, the Fed could be forced to move faster than anyone wants. And fast is the scenario history doesn’t like.
But for now, the weight of the evidence hasn’t changed much. The economy is growing, earnings are strong, and the S&P 500 is sitting within about 1% of its all-time high. A slow or one-and-done rate hike has historically been something the market can live with.
The bottom line? Whether the Fed hikes on September 16th is roughly a coin flip. But the more important question isn’t whether the Fed moves. It’s how many times, and how fast. A Fed that goes slow hasn’t ended bull markets. A Fed that has to hurry is another story.
This is intended for informational purposes only and should not be used as the primary basis for an investment decision. Consult an advisor for your personal situation.
Indices mentioned are unmanaged, do not incur fees, and cannot be invested into directly.
Past performance does not guarantee future results.
The S&P 500 Index, or Standard & Poor’s 500 Index, is a market-capitalization-weighted index of 500 leading publicly traded companies in the U.S.
The Dow Jones Industrial Average (DJIA) is a price-weighted index composed of 30 widely traded blue-chip U.S. common stocks. The Nasdaq 100 Index is a basket of the 100 largest, most actively traded U.S. companies listed on the Nasdaq stock exchange. The index includes companies from various industries except for the financial industry, like commercial and investment banks. The Russell 3000 Index is a capitalization-weighted stock market index that seeks to be a benchmark of the entire U.S. stock market. The S&P MidCap 400 is designed to measure the performance of 400 mid-sized companies, reflecting the distinctive risk and return characteristics of this market segment. S&P 600 Index measures the small-cap segment of the U.S. equity market. The index is designed to track companies that meet specific inclusion criteria to ensure that they are liquid and financially viable. The S&P 100 index is a capitalization-weighted index based on 100 highly capitalized stocks for which options are listed on the CBOE (Chicago Board of Exchange). The MSCI EAFE Index is an equity index which captures large and mid cap representation across 21 Developed Markets countries* around the world, excluding the US and Canada.
The Bloomberg U.S. Corporate Bond Index measures the investment grade, fixed-rate, taxable corporate bond market. The Bloomberg U.S. Corporate High Yield Index is comprised of domestic and corporate bonds rated Ba and below with a minimum outstanding amount of $150 million. The Bloomberg U.S. Municipal Index covers the USD-denominated long-term tax exempt bond market. The index has four main sectors: state and local general obligation bonds, revenue bonds, insured bonds and prerefunded bonds.