
OVERVIEW
KEY CONSIDERATIONS
Fewer Engines – On Monday, the S&P 500 jumped 1.5% and finished within 1% of its August record. On the surface, it was a good day. Underneath, though, something odd happened. About four times as many stocks in the index hit 52-week lows as hit 52-week highs.
That got attention. Some pointed out that a rally to within 1% of a record, with more stocks at lows than highs, had happened only twice before in almost 100 years: December 1999 and July 1929. Others pushed back, noting that by a broader measure, the share of S&P 500 stocks above their 200-day average, breadth is roughly a coin flip.
When an index sits near a record while most of the stocks inside it do not, the question becomes: is the index leading, or is the average stock giving a warning?
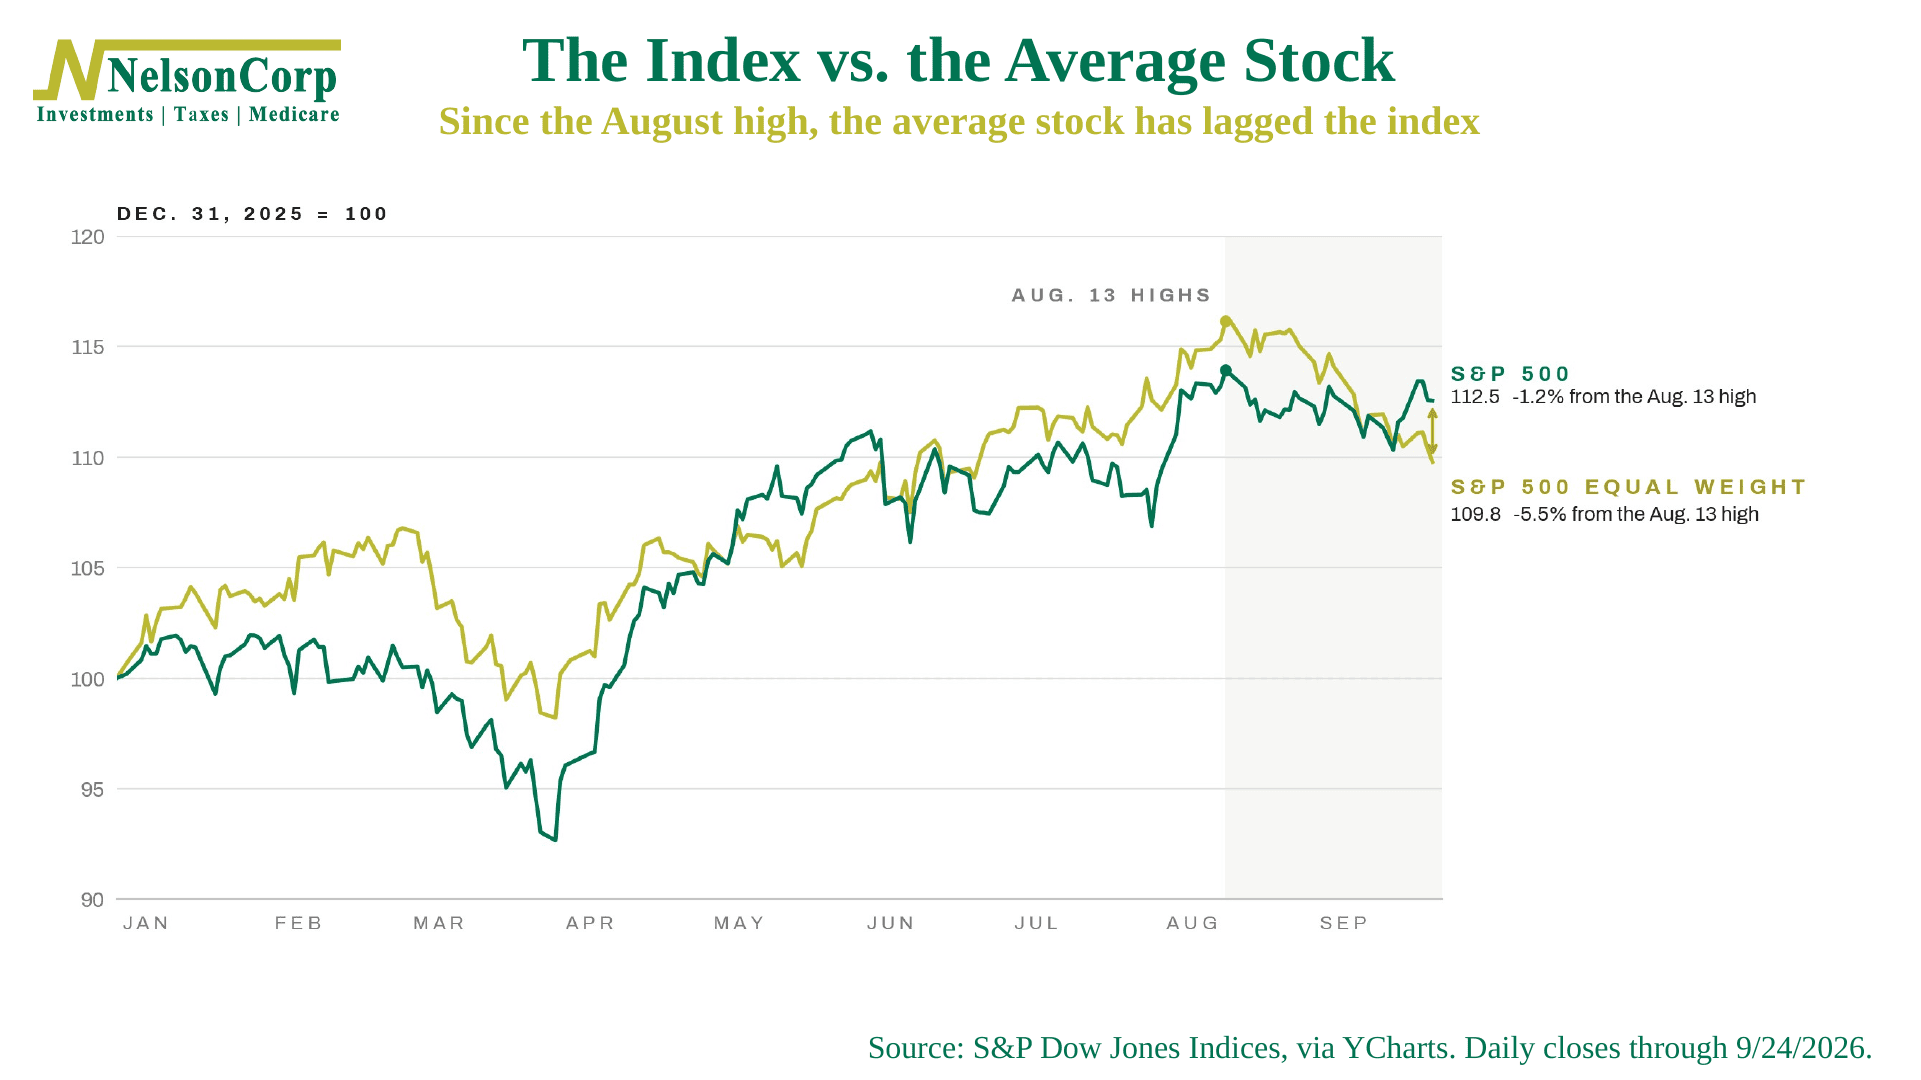
The first chart below shows the gap I’m talking about. It tracks the S&P 500 against an equal-weighted version of the same 500 stocks, both set to 100 at the start of the year. Think of the equal-weighted line as the average stock. Both peaked on August 13. Since then, the index has slipped 1.2% while the average stock has slipped 5.5%. Go back to the start of 2023, and we see that the index has doubled while the average stock is up about half as much.
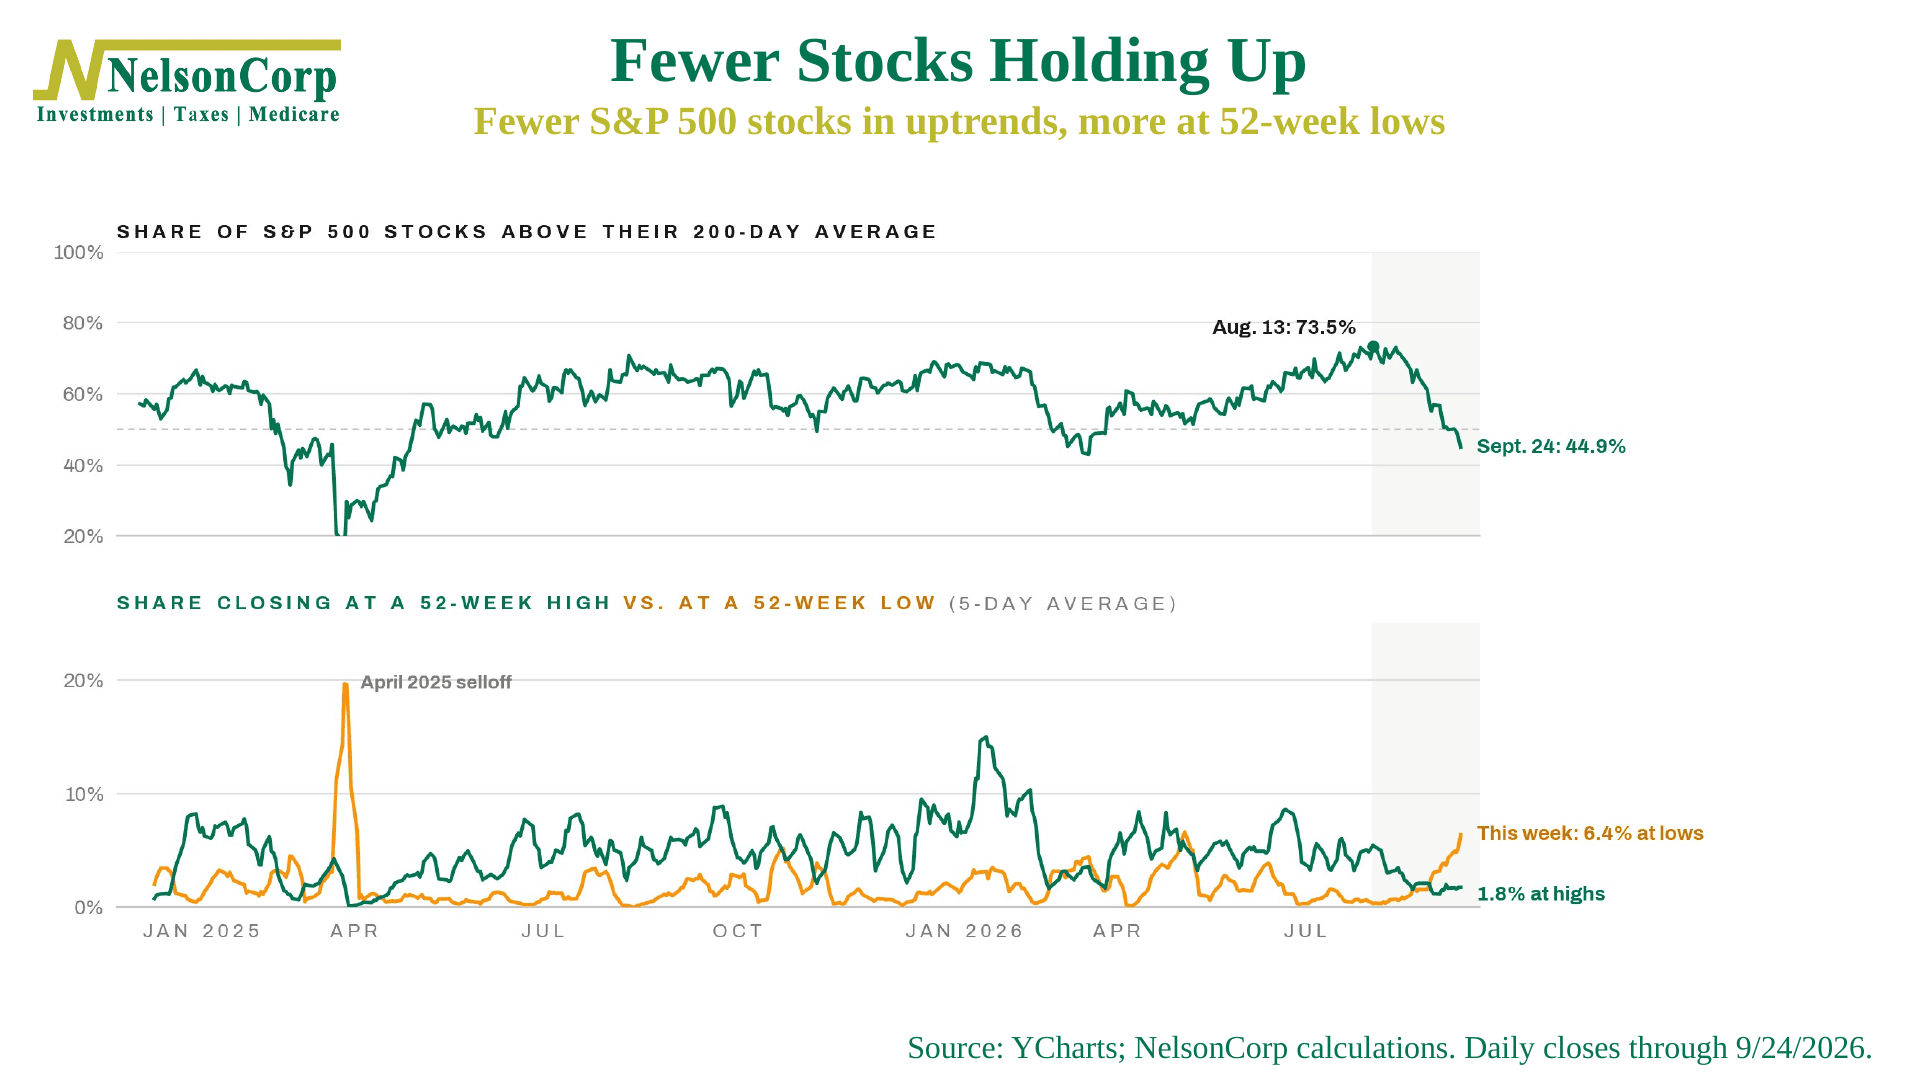
Ok, so that sets the stage, but this second chart puts some more meat on the bones. The top panel shows the share of S&P 500 stocks above their 200-day moving average, a simple test of whether a stock is still in an uptrend. On August 13, the day the index set its record, nearly three out of four members passed. On Thursday, 45% did. The bottom panel tracks stocks closing at 52-week highs against those closing at 52-week lows. This week, about 6% of the index’s members closed at a 52-week low on an average day, versus under 2% at a high. On Thursday alone, 9% closed at a low, the most on any day this year.
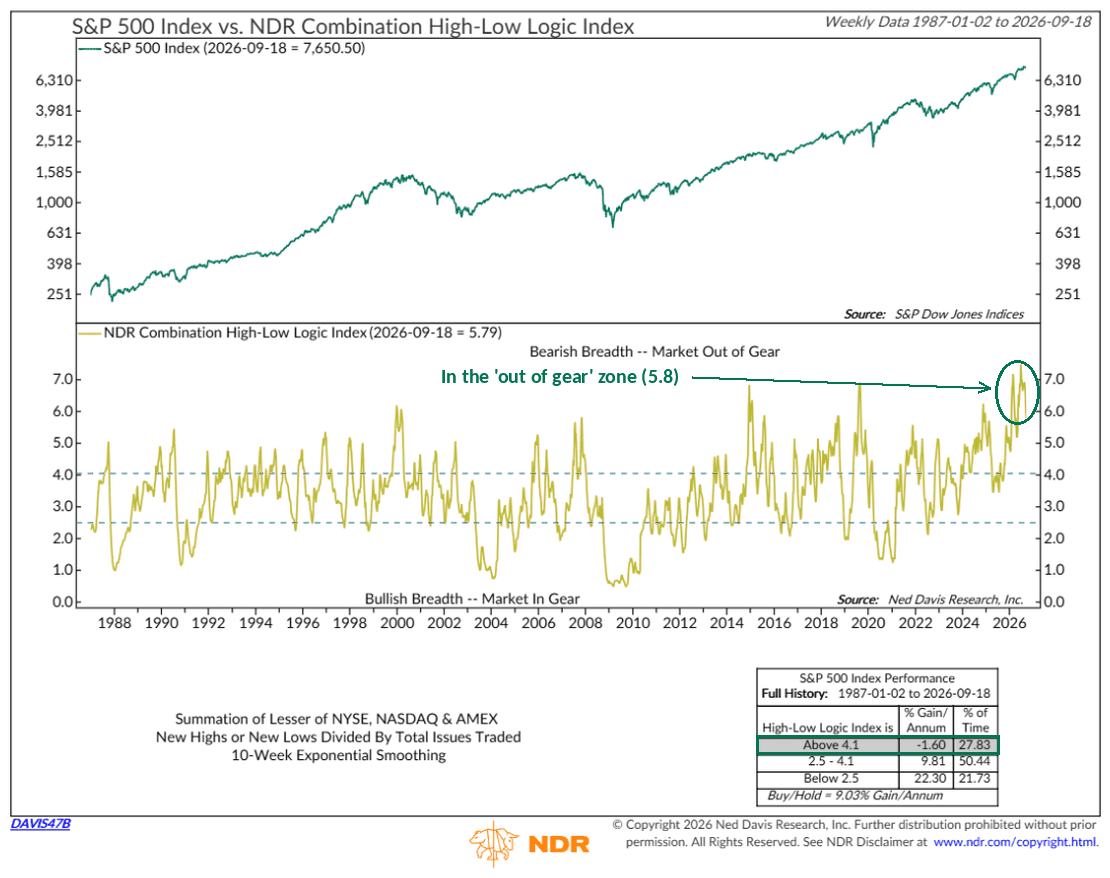
Now, this third and final chart should really drive home the point, but in a slightly different way. It takes the lesser of new highs or new lows each week and smooths it. Think of it as a “split market” gauge. When new highs and new lows are both plentiful, leaders and laggards are pulling in opposite directions, and the market is out of gear. Since 1987, readings above 4.1 have come with S&P 500 losses of 1.6% per year, versus gains of 22% per year below 2.5. Today it reads 5.8. It has been in that zone for most of the past year, and a few weeks ago it hit the highest reading in the nearly 40 years shown.
So, breadth is a caution flag, and the flag has been up for a while now. Of course, a split market can persist for months, as it did in 1999. But divergences like this usually resolve one of two ways: the average stock catches up, or the index catches down. History certainly has examples of both.
But, to be fair, the rest of the evidence still leans positive, which is why I treat this as a reason for tempered expectations rather than alarm. Of the six participation indicators on our scorecard, two are positive, one is neutral, and three are negative, so the group sits at neutral. Our trend-based indicators remain positive, and the overall scorecard is still comfortably in positive territory.
Of course, the bond market is on the other side of the ledger. The 10-year Treasury yield reached 5.19% on Thursday, its highest since 2007, and the 5-year crossed 5% for the first time since that same year, enough to knock the S&P 500 down 0.7% on Wednesday. Oil, the subject of this week’s Indicator Insights, has at least eased into the low $90s. And as we covered in this week’s Chart of the Week, investors are heavily positioned in stocks, which leaves less room for error.
The bottom line? The index is near a record, but most of the stocks in it are not. The market is running on fewer engines than the headlines suggest, and that argues for realistic expectations while the trend holds.
This is intended for informational purposes only and should not be used as the primary basis for an investment decision. Consult an advisor for your personal situation.
Indices mentioned are unmanaged, do not incur fees, and cannot be invested into directly.
Past performance does not guarantee future results.
The S&P 500 Index, or Standard & Poor’s 500 Index, is a market-capitalization-weighted index of 500 leading publicly traded companies in the U.S. The S&P 500 Equal Weight Index is a version of the S&P 500 in which each of the 500 companies is given the same weight, so it reflects the performance of the average stock in the index rather than the largest companies.
The Dow Jones Industrial Average (DJIA) is a price-weighted index composed of 30 widely traded blue-chip U.S. common stocks. The Nasdaq 100 Index is a basket of the 100 largest, most actively traded U.S. companies listed on the Nasdaq stock exchange. The index includes companies from various industries except for the financial industry, like commercial and investment banks. The Russell 3000 Index is a capitalization-weighted stock market index that seeks to be a benchmark of the entire U.S. stock market. The S&P MidCap 400 is designed to measure the performance of 400 mid-sized companies, reflecting the distinctive risk and return characteristics of this market segment. S&P 600 Index measures the small-cap segment of the U.S. equity market. The index is designed to track companies that meet specific inclusion criteria to ensure that they are liquid and financially viable. The S&P 100 index is a capitalization-weighted index based on 100 highly capitalized stocks for which options are listed on the CBOE (Chicago Board of Exchange). The MSCI EAFE Index is an equity index which captures large and mid cap representation across 21 Developed Markets countries* around the world, excluding the US and Canada.
The Bloomberg U.S. Corporate Bond Index measures the investment grade, fixed-rate, taxable corporate bond market. The Bloomberg U.S. Corporate High Yield Index is comprised of domestic and corporate bonds rated Ba and below with a minimum outstanding amount of $150 million. The Bloomberg U.S. Municipal Index covers the USD-denominated long-term tax exempt bond market. The index has four main sectors: state and local general obligation bonds, revenue bonds, insured bonds and prerefunded bonds.