
OVERVIEW
KEY CONSIDERATIONS
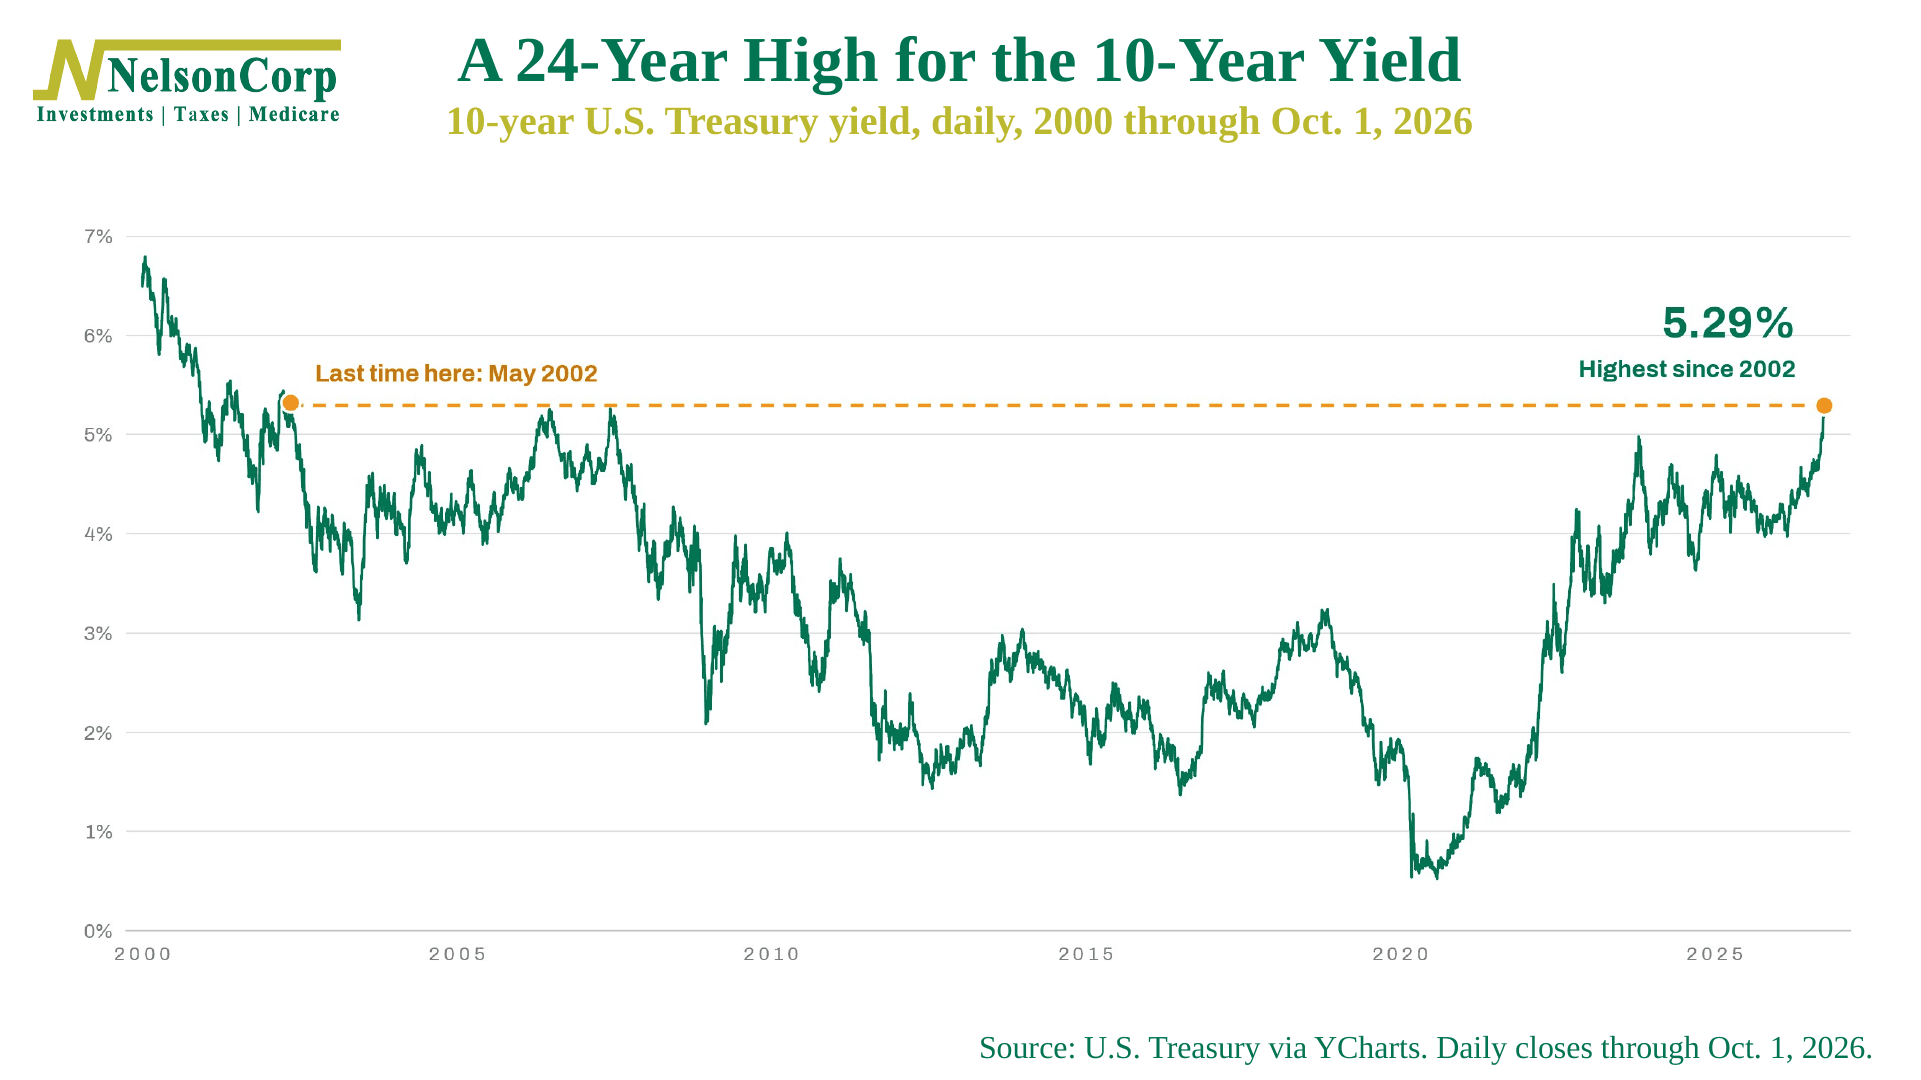
Calm Under Pressure – Let’s start with the number that mattered most this week: 5.29%.
That’s where the 10-year Treasury yield closed on Wednesday. The last time it was that high was 2002. It started this year at 4.18%, so we’re talking about a jump of more than a full percentage point, and almost half of it came in September alone.
The first chart below shows what I’m talking about. The 10-year is now above its 2007 high, and above the 2023 high, when a run toward 5% knocked about 10% off the S&P 500 before yields cooled off.
So why are yields climbing? Inflation would be the obvious answer, but the bond market says otherwise. The second chart splits the 10-year yield into two pieces: the inflation investors expect over the next decade, and the extra return they want on top of that, which is called the real yield. Expected inflation has barely moved this year. The real yield has done almost all the climbing, from about 1.9% to 2.9%, the highest since 2008.
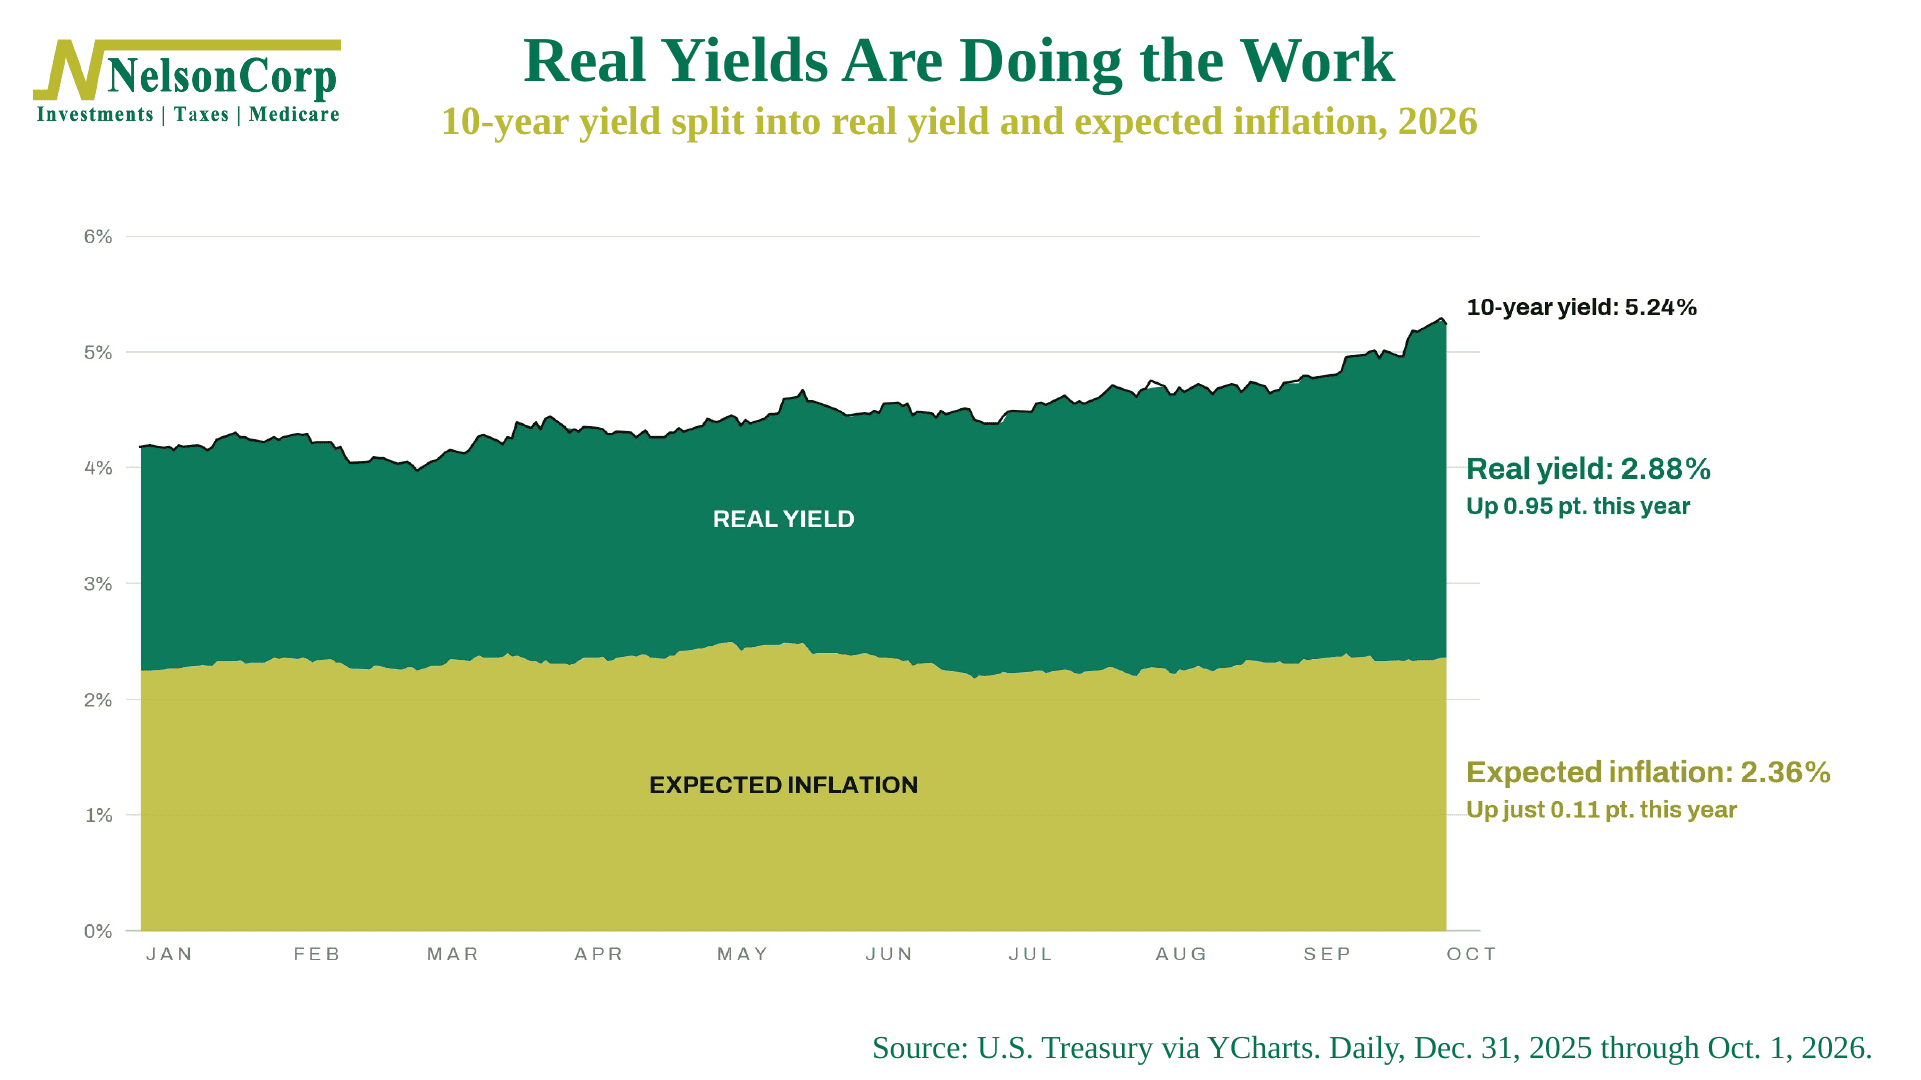
In other words, lenders want more, after inflation, to hold government bonds than at any time in almost two decades. Why? Take your pick. The government is borrowing a lot, the AI buildout is soaking up capital, and the economy keeps refusing to slow down. Whatever the reason, that’s tough competition for stocks. It raises the bar for everything else.
We saw that in September. The S&P 500 slipped less than half a percent, thanks mostly to technology stocks. The average stock in the index fell about 5%. And the Russell 2000, an index of smaller companies that rely more on borrowed money, dropped more than 5% for the month and 7.5% for the quarter.
Ok, but here’s the thing. Rising rates by themselves don’t really end bull markets. Rising rates plus a credit scare? Now that’s a dangerous combination.
Which brings us to this week’s Indicator Insights, “No Stress.” This chart tracks the gap between what riskier companies pay to borrow and what the safest companies pay. When lenders get nervous, that gap widens. Right now, measured against its own trend, it’s the narrowest it has been since 1954. Oh yeah, and the indicator also shows that readings this low have historically come with the strongest earnings growth. Something to keep in mind.
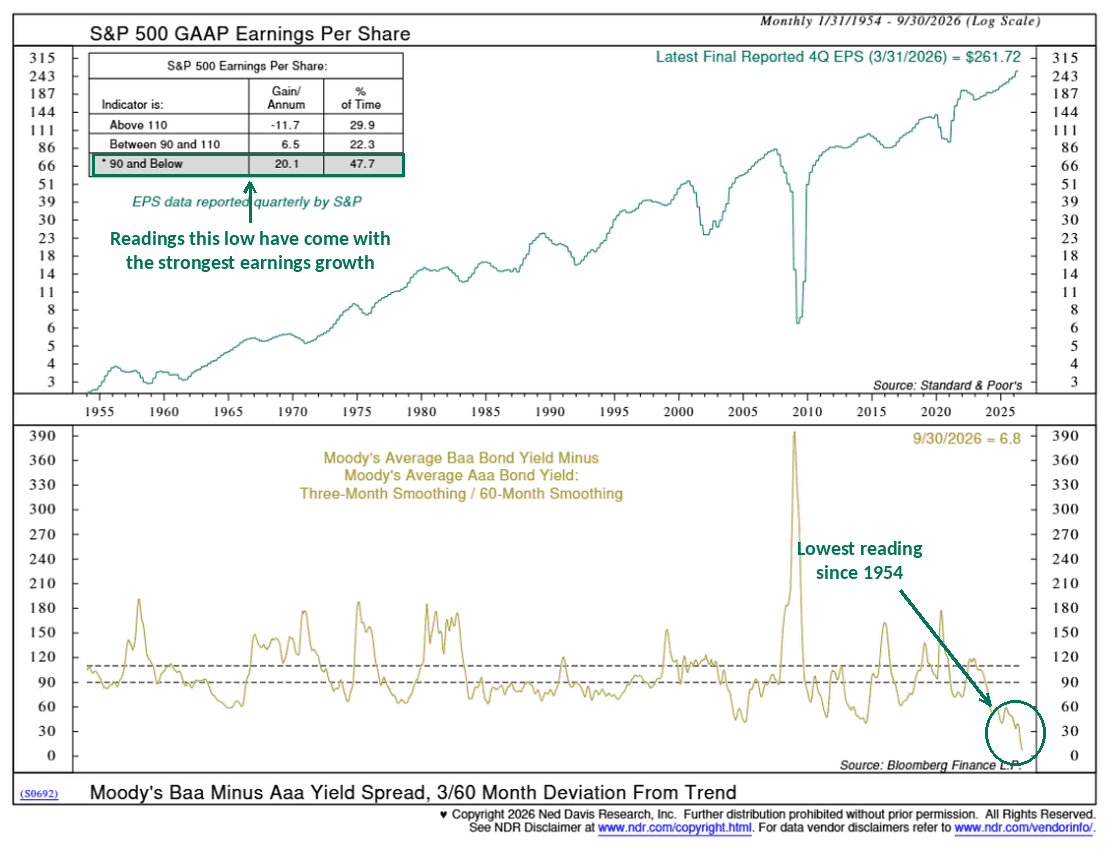
Ok, so basically all this is to say that the bond market is just talking about the price of money. Whereas borrowers, for the most part, so far, look fine.
And our risk management “scorecard” mostly agrees. It still counts the weight of the evidence as having more positives than negatives. Rates are the weak spot, sure, but those indicators have been negative for months. The economic, inflation, and credit indicators are all still positive.
Of course, then there was Friday, which made things even more interesting. A weak jobs report cut the odds of a Fed hike this month from about 70% to about 14%. In response, the 10-year eased back toward 5.2%, and stocks loved it.
And as we showed in this week’s Chart of the Week, the S&P 500 has made its high for the year in the fourth quarter in 33 of the past 46 years. In other words, the calendar is on the market’s side.
The bottom line? A 24-year high in the 10-year yield is the biggest risk this bull market faces. The weight of the evidence says the market can handle it, as long as credit stays calm. Pressure is rising. But so far, the calm is holding.
This is intended for informational purposes only and should not be used as the primary basis for an investment decision. Consult an advisor for your personal situation.
Indices mentioned are unmanaged, do not incur fees, and cannot be invested into directly.
Past performance does not guarantee future results.
The S&P 500 Index, or Standard & Poor’s 500 Index, is a market-capitalization-weighted index of 500 leading publicly traded companies in the U.S. The S&P 500 Equal Weight Index is a version of the S&P 500 in which each of the 500 companies is given the same weight, so it reflects the performance of the average stock in the index rather than the largest companies.
The Dow Jones Industrial Average (DJIA) is a price-weighted index composed of 30 widely traded blue-chip U.S. common stocks. The Nasdaq 100 Index is a basket of the 100 largest, most actively traded U.S. companies listed on the Nasdaq stock exchange. The index includes companies from various industries except for the financial industry, like commercial and investment banks. The Russell 3000 Index is a capitalization-weighted stock market index that seeks to be a benchmark of the entire U.S. stock market. The S&P MidCap 400 is designed to measure the performance of 400 mid-sized companies, reflecting the distinctive risk and return characteristics of this market segment. S&P 600 Index measures the small-cap segment of the U.S. equity market. The index is designed to track companies that meet specific inclusion criteria to ensure that they are liquid and financially viable. The S&P 100 index is a capitalization-weighted index based on 100 highly capitalized stocks for which options are listed on the CBOE (Chicago Board of Exchange). The MSCI EAFE Index is an equity index which captures large and mid cap representation across 21 Developed Markets countries* around the world, excluding the US and Canada.
The Bloomberg U.S. Corporate Bond Index measures the investment grade, fixed-rate, taxable corporate bond market. The Bloomberg U.S. Corporate High Yield Index is comprised of domestic and corporate bonds rated Ba and below with a minimum outstanding amount of $150 million. The Bloomberg U.S. Municipal Index covers the USD-denominated long-term tax exempt bond market. The index has four main sectors: state and local general obligation bonds, revenue bonds, insured bonds and prerefunded bonds.