
OVERVIEW
KEY CONSIDERATIONS
Musical Chairs – Last week was a pretty interesting, volatile—and somewhat backward—one on Wall Street. Chip stocks, the market’s leaders all year, fell seven days in a row. But on Thursday, the Dow jumped more than 500 points. Inflation also came in hot, but bond yields went down. Oh, and the biggest banks reported record lending income, but then their stocks dropped.
All that seems a bit strange, right. So, what exactly is going on?
Well, here’s the one idea that explains a lot of it: money is simply moving—or rotating. For two years, investors have crowded into anything tied to artificial intelligence. Last week, that trade wobbled, and the crowd went looking for other chairs to sit in. You can see the shuffle in this first chart.
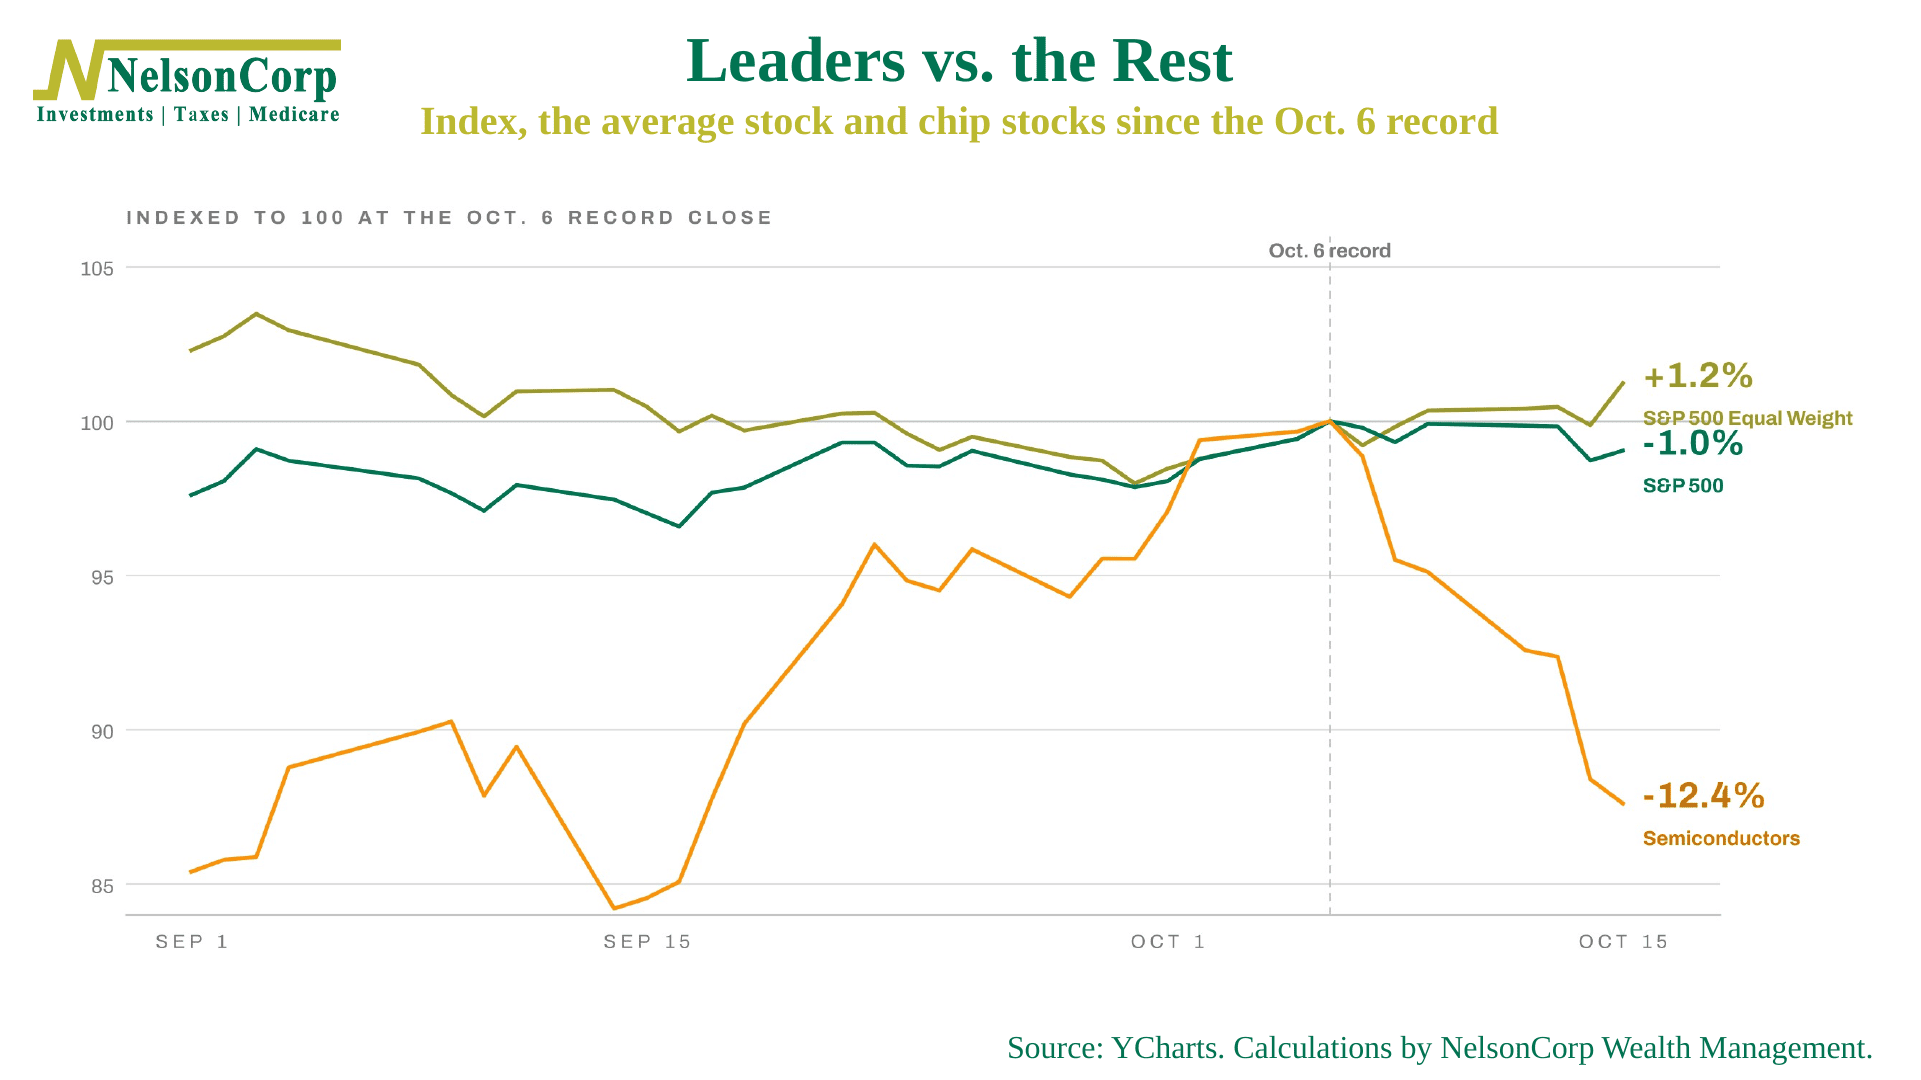
Since the S&P 500’s record on October 6, the index is down about 1%. But look at the other two lines. The average stock, measured by the equal-weight version of the index, is up more than 1%, while chip stocks are down 12%. In other words, the leaders fell, and the rest of the market caught the money.
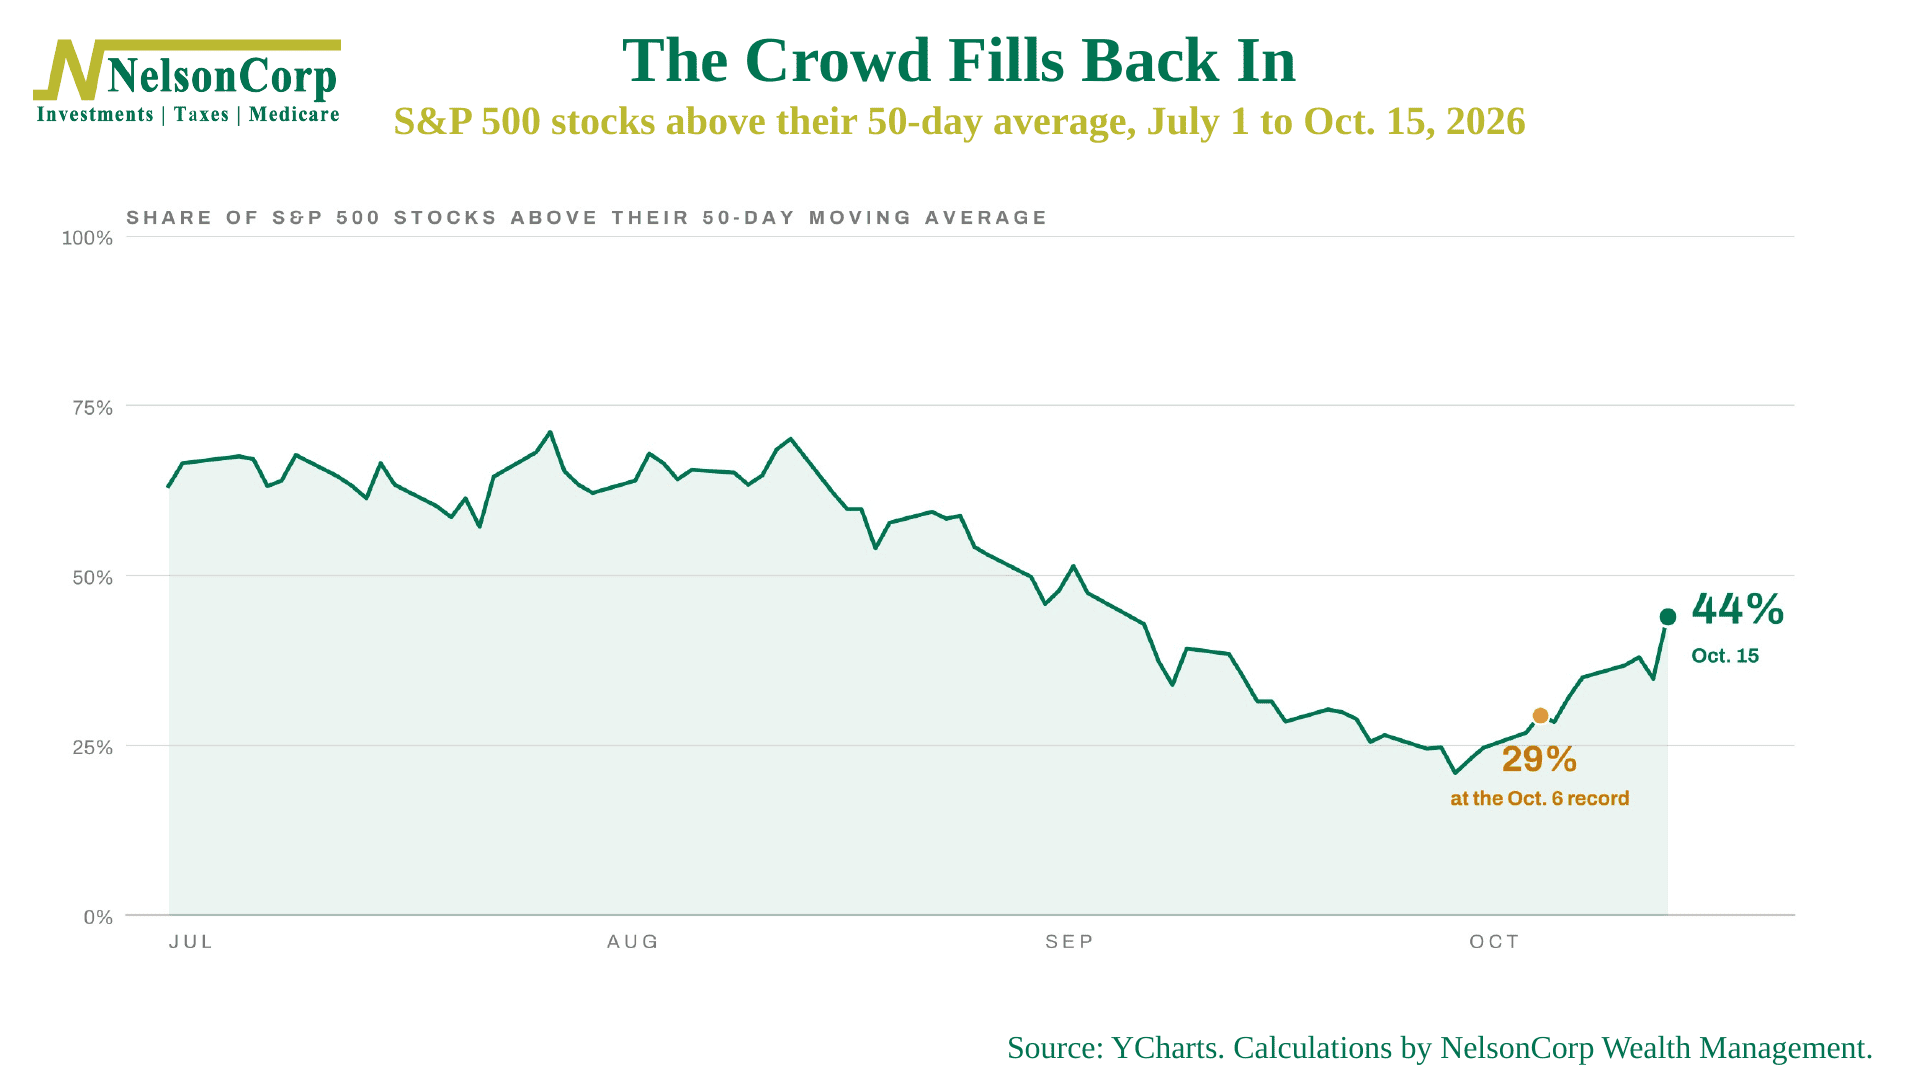
That brings me to the chart I find most encouraging. At the October 6th record, only 29% of the stocks in the S&P 500 were above their 50-day moving average (a typical measure of market trend). But by Thursday, 44% were. In other words, the market got healthier underneath, even as the headline number slipped.
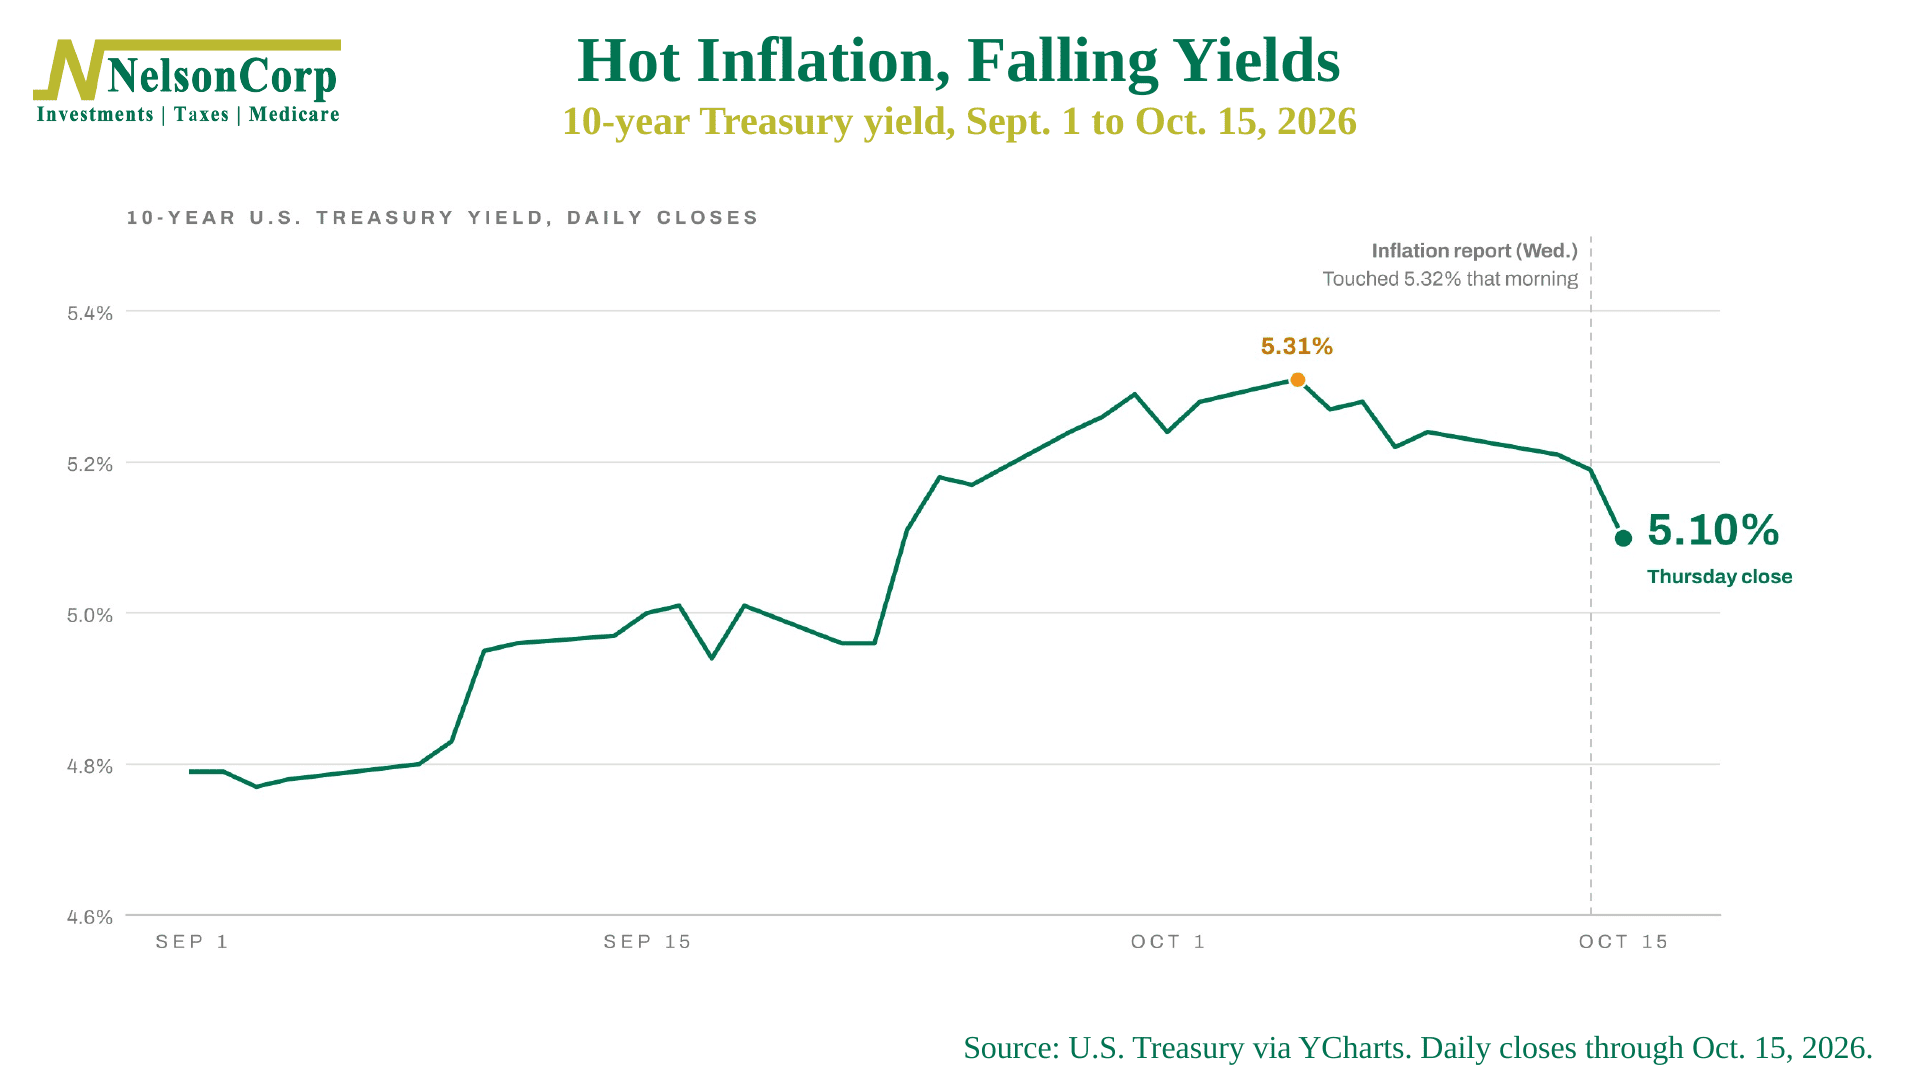
And stocks weren’t the only place the money went. Bonds were a chair, too. The 10-year Treasury yield touched 5.32% on Wednesday’s hot inflation report, then turned around and finished Thursday at 5.10%. Basically, some of the money leaving AI stocks simply needed somewhere safe to sit.
Ok, so if money is spreading out and the market is getting healthier underneath, why are our models saying to be careful?
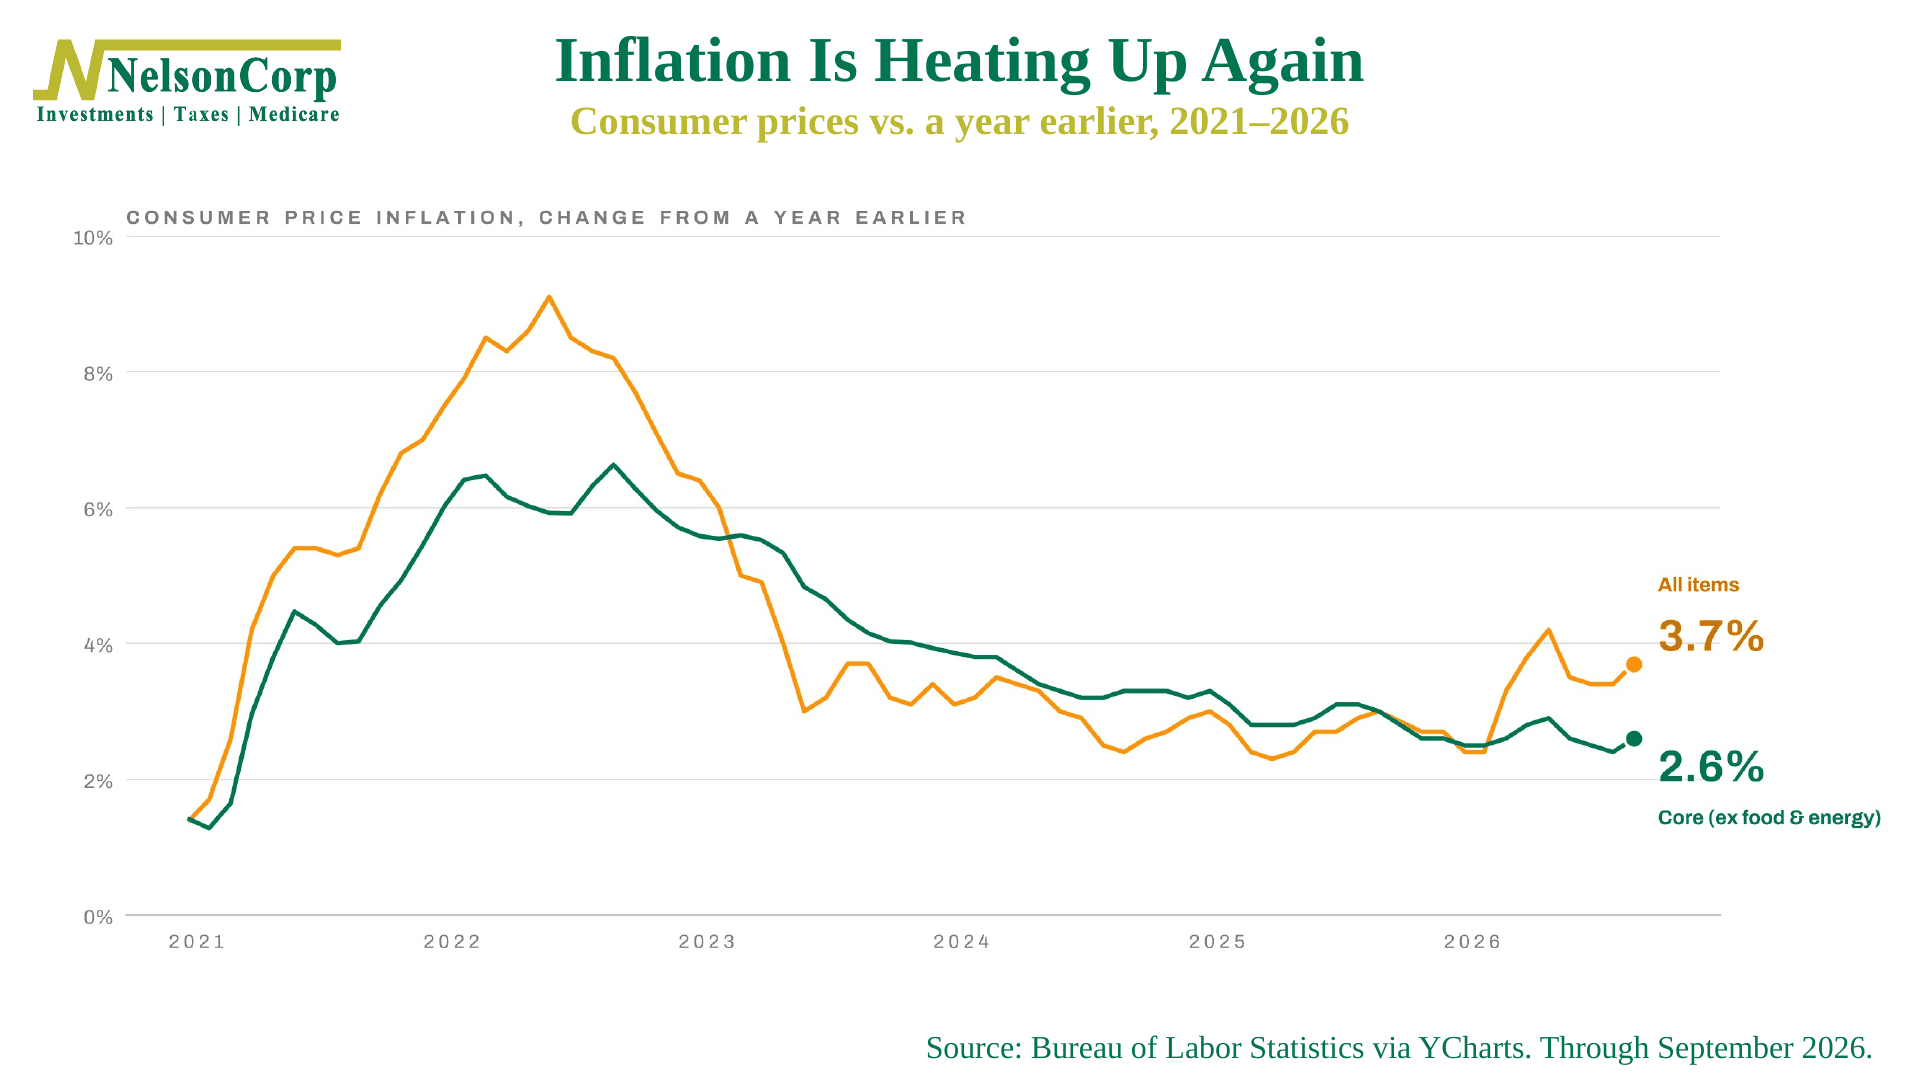
Well, start with that inflation report last week. Consumer prices rose 3.7% from a year ago, producer prices jumped the most since 2022, and factories have now been humming for nine straight months, as we showed in last week’s Chart of the Week. That is a hot economy, and a Fed that was expected to pause this month is still talking about raising rates later this year.
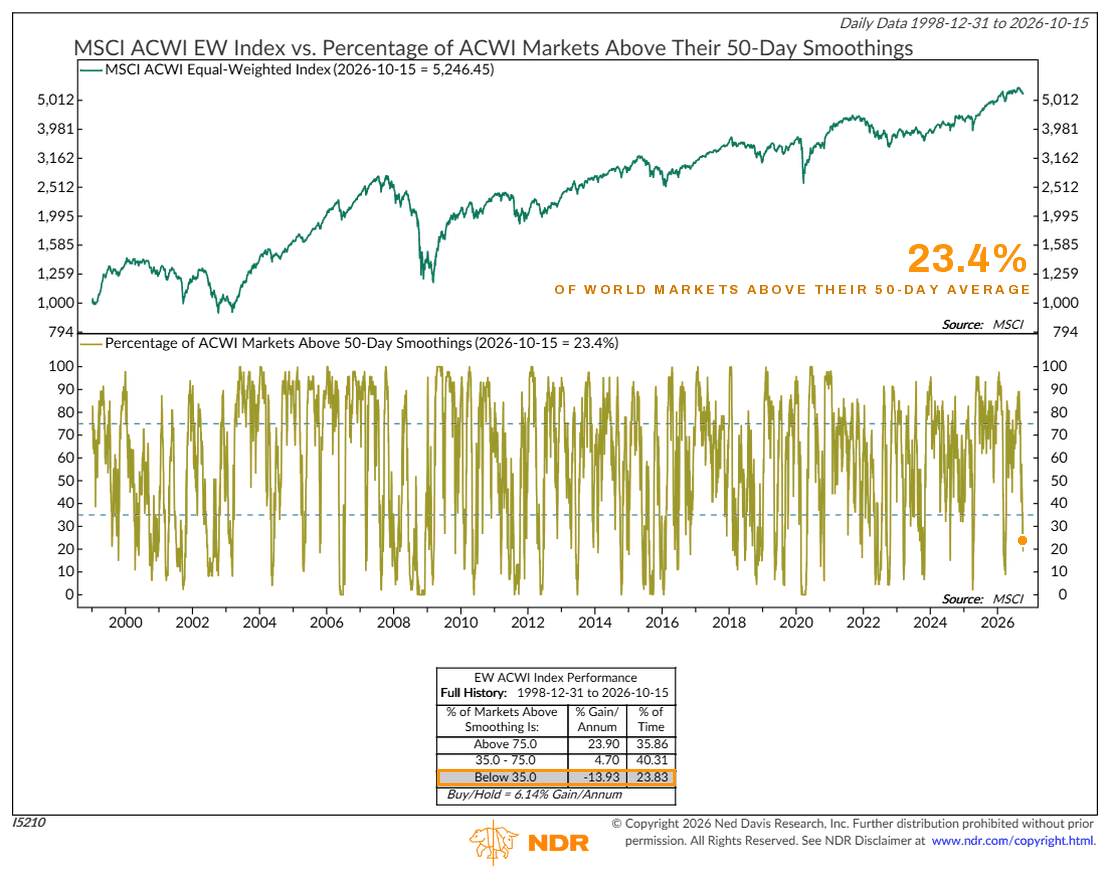
Then there’s the rest of the world, which isn’t helping either. Fewer than a quarter of the world’s stock markets are above their 50-day average. Historically, global stocks have lost about 14% a year in that zone, versus gains of about 24% a year when most markets are trending up.
Add in last week’s Indicator Insights, where the buying-and-selling pressure gauge we follow just tipped toward the sellers, and you can see why we have been leaning more defensive lately. In other words, if you’re playing musical chairs, you really want to be near a chair before the music stops.
So, the bottom line? The rotation we hoped for has started, and we would love to see it continue: more stocks joining in, the rest of the world catching up, and the leaders finding their footing. Until then, the weight of the evidence argues for caution, and making sure you keep a chair close by.
This is intended for informational purposes only and should not be used as the primary basis for an investment decision. Consult an advisor for your personal situation.
Indices mentioned are unmanaged, do not incur fees, and cannot be invested into directly.
Past performance does not guarantee future results.
The S&P 500 Index, or Standard & Poor’s 500 Index, is a market-capitalization-weighted index of 500 leading publicly traded companies in the U.S. The S&P 500 Equal Weight Index is a version of the S&P 500 in which each of the 500 companies is given the same weight, so it reflects the performance of the average stock in the index rather than the largest companies.
The Dow Jones Industrial Average (DJIA) is a price-weighted index composed of 30 widely traded blue-chip U.S. common stocks. The Nasdaq 100 Index is a basket of the 100 largest, most actively traded U.S. companies listed on the Nasdaq stock exchange. The index includes companies from various industries except for the financial industry, like commercial and investment banks. The Russell 3000 Index is a capitalization-weighted stock market index that seeks to be a benchmark of the entire U.S. stock market. The S&P MidCap 400 is designed to measure the performance of 400 mid-sized companies, reflecting the distinctive risk and return characteristics of this market segment. S&P 600 Index measures the small-cap segment of the U.S. equity market. The index is designed to track companies that meet specific inclusion criteria to ensure that they are liquid and financially viable. The S&P 100 index is a capitalization-weighted index based on 100 highly capitalized stocks for which options are listed on the CBOE (Chicago Board of Exchange). The MSCI EAFE Index is an equity index which captures large and mid cap representation across 21 Developed Markets countries* around the world, excluding the US and Canada.
The Bloomberg U.S. Corporate Bond Index measures the investment grade, fixed-rate, taxable corporate bond market. The Bloomberg U.S. Corporate High Yield Index is comprised of domestic and corporate bonds rated Ba and below with a minimum outstanding amount of $150 million. The Bloomberg U.S. Municipal Index covers the USD-denominated long-term tax exempt bond market. The index has four main sectors: state and local general obligation bonds, revenue bonds, insured bonds and prerefunded bonds.