OVERVIEW
KEY CONSIDERATIONS
No Respect – Well, Rodney Dangerfield built an entire career on one line: “I don’t get no respect.” If the stock market could talk right now, it might borrow it.
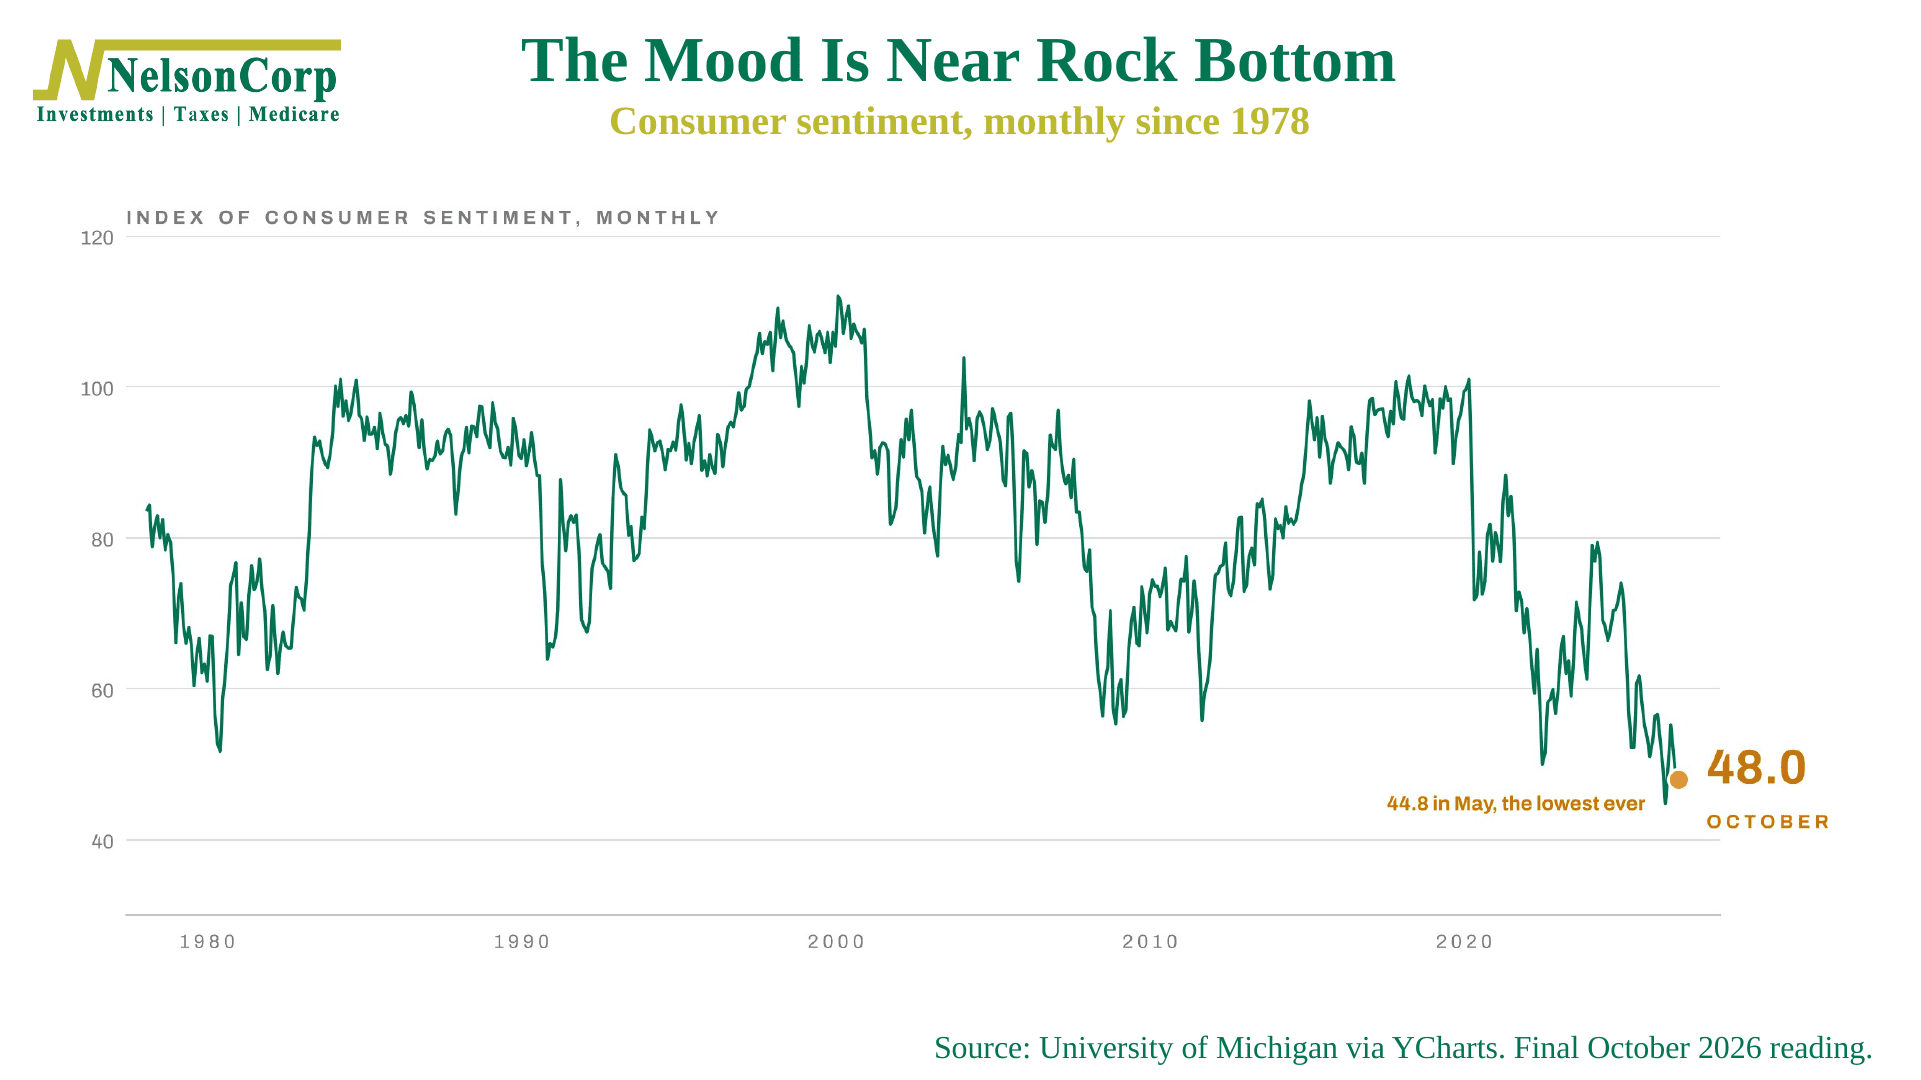
Think about it. The S&P 500 is up about 12% this year. The average stock in it is up almost 14%. And yet consumer confidence just posted its second-lowest reading in nearly 50 years of surveys—the five lowest readings ever have all come this year.
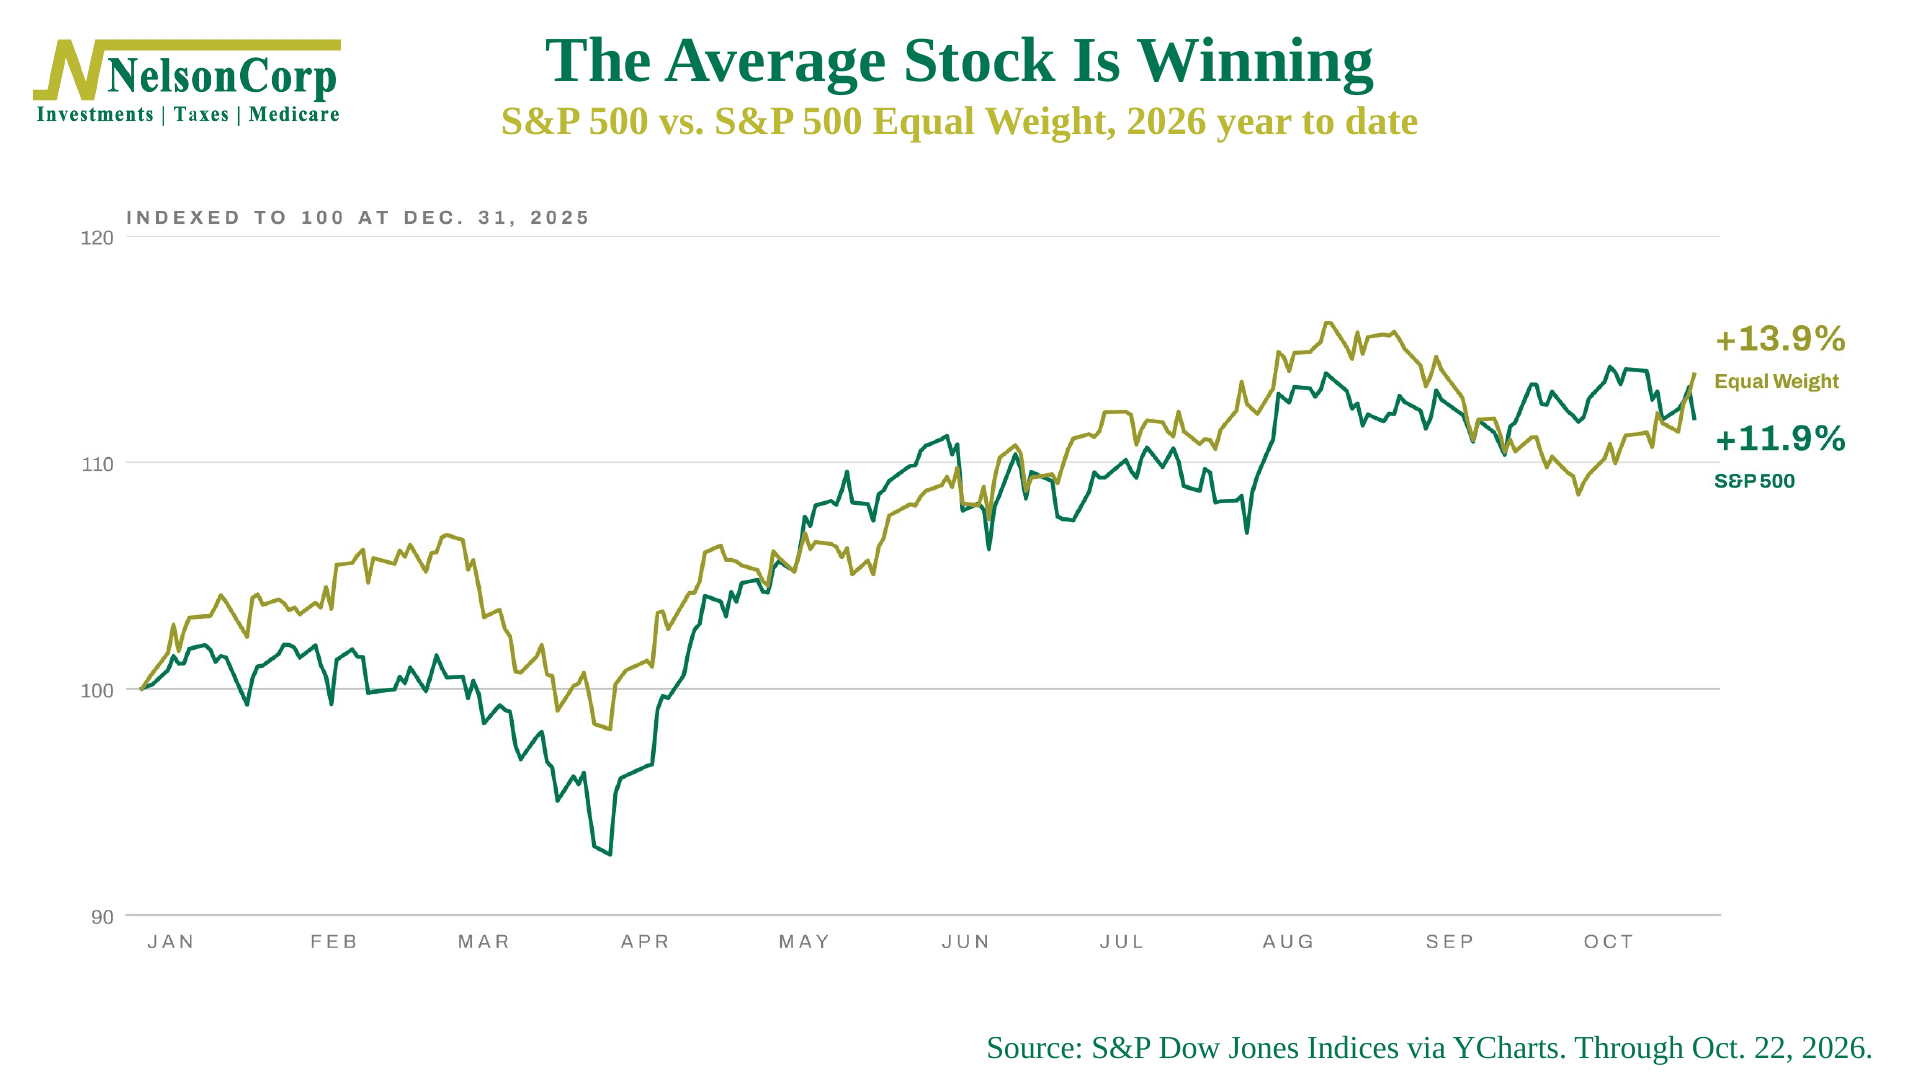
Now, some of that gloom has started to show up in prices. Last week was bumpy. The index had its worst day since July on Thursday, and it has slipped about 2% from its early-October high. But look underneath. Even on Thursday, about three out of every four stocks in the S&P 500 went up. And the equal-weight version of the index (where every company counts the same) is still ahead of the regular index for the year. So the average stock is doing better than its reputation.
So, does the market deserve the disrespect?
Well, part of the answer is that all this gloom is actually a point in the market’s favor. When pessimism runs this deep, a lot of bad news is already priced in, and the indicators we follow read heavy hedging and bearish bets as a contrary signal. In other words, the lack of respect is one of the few things the market has going for it.
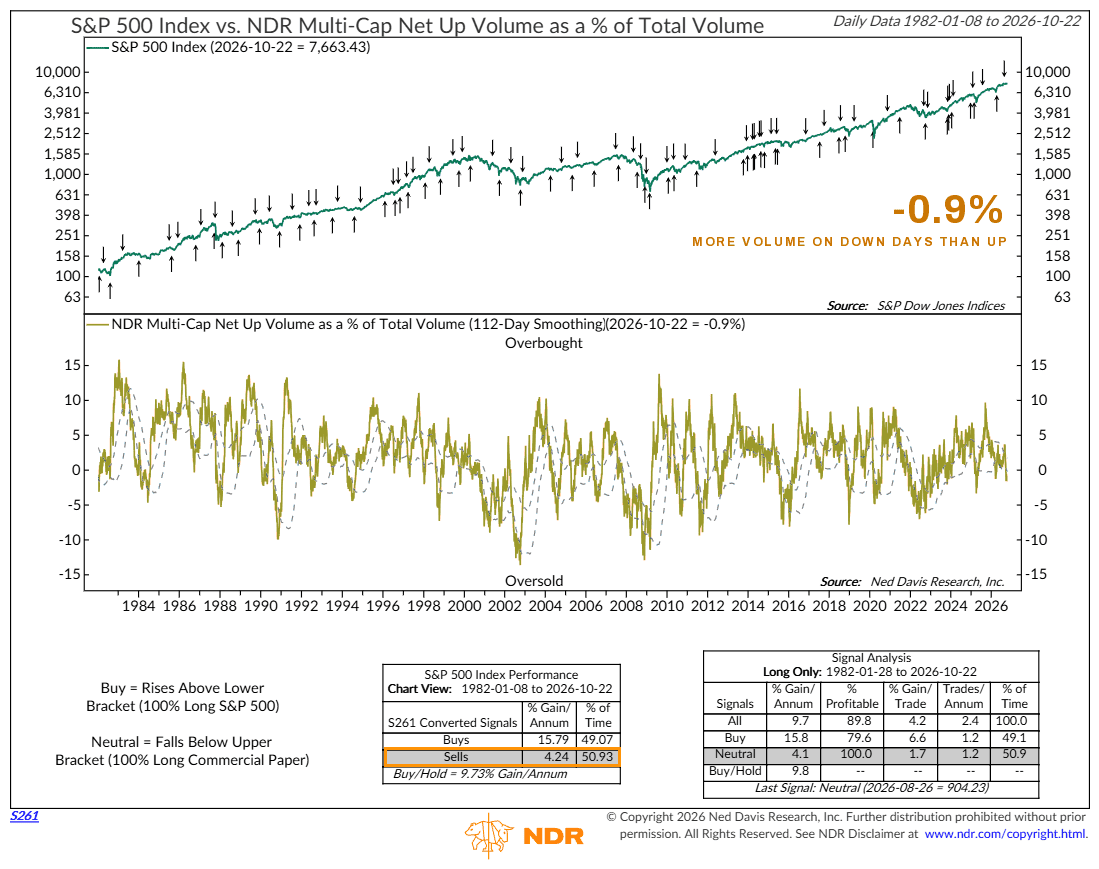
Ok, but here’s the problem. Underneath the surface, the selling has been winning. The chart below tracks how much of the market’s trading volume happens on up days versus down days, smoothed out over about six months. It just slipped below zero, meaning more money has been changing hands on down days than up days lately. Historically, stocks have gained about 16% a year when this gauge is on a buy signal and only about 4% a year when it’s on a sell signal—and it flipped to sell in late August. That fits with last week’s Indicator Insights on the market getting picky.
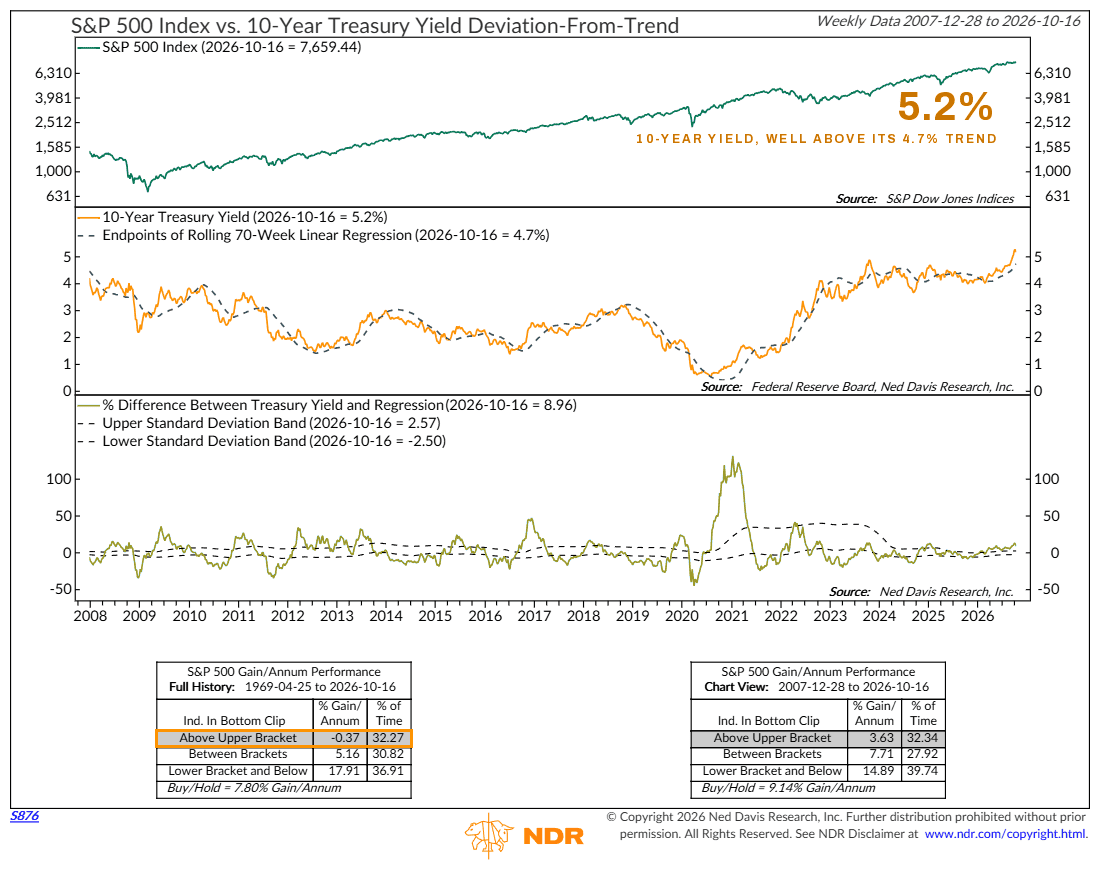
Then there’s the other headwind: interest rates. The 10-year Treasury yield has been running well above its own trend line all year. When that has been the case, stocks have basically gone nowhere—about 0% a year on average since 1969, compared with roughly 18% a year when yields are running below trend. Bonds rallied hard last week, and that helps, but it hasn’t closed the gap yet.
And this week brings the test. The Fed decides on rates Wednesday, third-quarter growth and the Fed’s preferred inflation gauge land Thursday, and three of the biggest companies in the world report earnings in between.
So, the bottom line? The market wants to get its respect. It will likely earn it back when the selling underneath lets up and rates stop fighting it. But until then, the weight of the evidence says it pays to be patient rather than brave.
This is intended for informational purposes only and should not be used as the primary basis for an investment decision. Consult an advisor for your personal situation.
Indices mentioned are unmanaged, do not incur fees, and cannot be invested into directly.
Past performance does not guarantee future results.
The S&P 500 Index, or Standard & Poor’s 500 Index, is a market-capitalization-weighted index of 500 leading publicly traded companies in the U.S. The S&P 500 Equal Weight Index is a version of the S&P 500 in which each of the 500 companies is given the same weight, so it reflects the performance of the average stock in the index rather than the largest companies.
The Dow Jones Industrial Average (DJIA) is a price-weighted index composed of 30 widely traded blue-chip U.S. common stocks. The Nasdaq 100 Index is a basket of the 100 largest, most actively traded U.S. companies listed on the Nasdaq stock exchange. The index includes companies from various industries except for the financial industry, like commercial and investment banks. The Russell 3000 Index is a capitalization-weighted stock market index that seeks to be a benchmark of the entire U.S. stock market. The S&P MidCap 400 is designed to measure the performance of 400 mid-sized companies, reflecting the distinctive risk and return characteristics of this market segment. S&P 600 Index measures the small-cap segment of the U.S. equity market. The index is designed to track companies that meet specific inclusion criteria to ensure that they are liquid and financially viable. The S&P 100 index is a capitalization-weighted index based on 100 highly capitalized stocks for which options are listed on the CBOE (Chicago Board of Exchange). The MSCI EAFE Index is an equity index which captures large and mid cap representation across 21 Developed Markets countries* around the world, excluding the US and Canada.
The Bloomberg U.S. Corporate Bond Index measures the investment grade, fixed-rate, taxable corporate bond market. The Bloomberg U.S. Corporate High Yield Index is comprised of domestic and corporate bonds rated Ba and below with a minimum outstanding amount of $150 million. The Bloomberg U.S. Municipal Index covers the USD-denominated long-term tax exempt bond market. The index has four main sectors: state and local general obligation bonds, revenue bonds, insured bonds and prerefunded bonds.