OVERVIEW
U.S. stocks rose moderately last week, as the S&P 500 index gained 0.62 percent. The Materials sector led the S&P 500, gaining 1.9 percent. Utilities, however, lost 1.4 percent for the week, lagging all the other sectors.
In a reversal from the prior week, developed country stocks surged more than two percent, outpacing the 1.5 percent gain for emerging market stocks.
In the fixed-income world, the yield on U.S. 10-year Treasury bonds ticked up to about 1.7 percent, resulting in price declines for most bonds. Nonetheless, yields remain within an arm’s reach of all-time lows, and both U.S. government bonds and corporate bonds are doing exceedingly well this year.
Substantial gains in the price of corn and oil nudged the commodity price index higher last week by about one percent. As expected, the U.S. dollar dropped about half a percent.
KEY CONSIDERATIONS
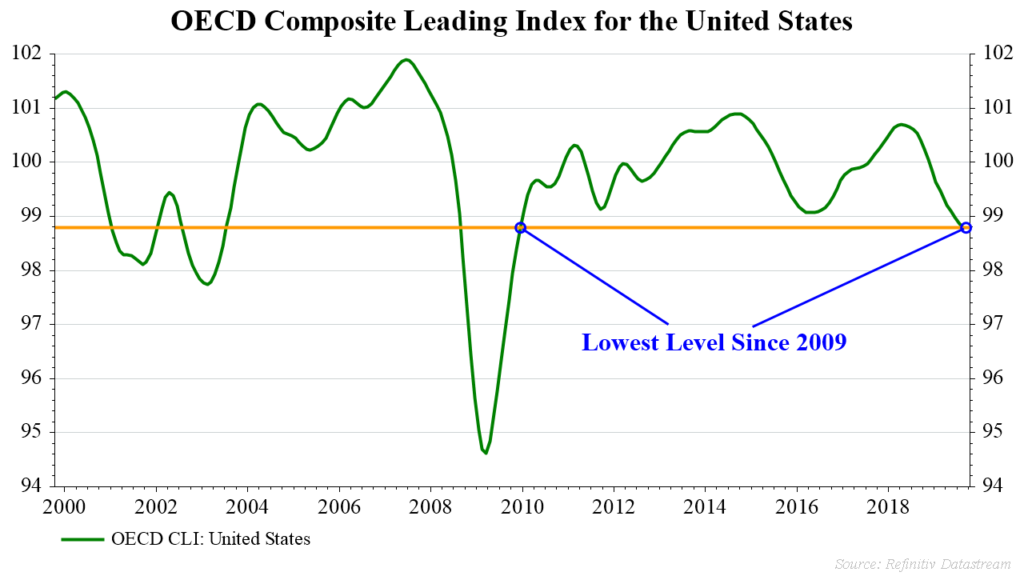
Leading The Way – A composite leading indicator is a tool designed to anticipate turning points in economic activity relative to a long-trend trend. The Organization for Economic Cooperation and Development (OECD) produces these composite leading indicators (CLIs) for many countries around the globe and releases this data to the public every month.
According to these leading indicators, growth is weak. The OECD CLIs show poor growth momentum in the United States and the euro area as a whole, particularly in Germany. The share of these indicators rising on a year-over-year basis has gone from virtually zero to about 18 percent this year; however, this is still low compared to last year’s reading of around 90 percent.
As for the United States, the OECD CLI recently fell to its lowest level since November 2009. It was also the reading’s ninth straight month below 100, indicating a below average growth outlook. This is probably not a good sign for the U.S. economy.

Two critical components of the U.S. CLIs, manufacturing and consumer confidence, have both been weak. Interestingly enough, stock prices are another component of the series, and these have shown themselves to be quite resilient.
In Search Of A Rally – Since stock prices are forward-looking by nature, they can sometimes tell us what to expect for future economic growth. And if the economy is expected to keep growing, that also bodes well for future stock prices. Call it a feedback loop; it’s not always precise, but it is worth examining.
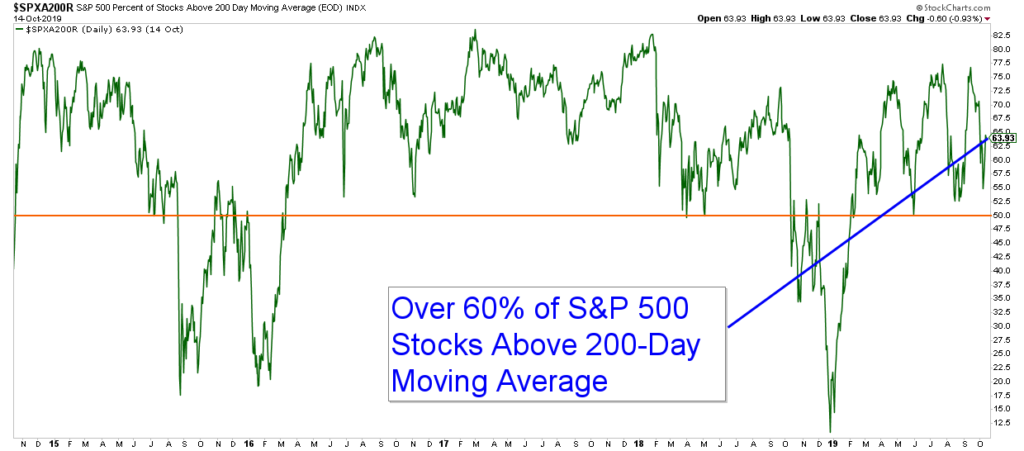
So, can the stock market rally from here? There is some evidence suggesting it can. Over 60 percent of U.S. stocks are higher than their average 200-day price.

We are also seeing the amount (or volume) of trading in companies that are advancing in price outpacing the volume in companies that are declining in price. This is good because volume thrusts like these can ripple through stocks and help maintain a rally for many months after they occur.
According to most surveys, investors aren’t all that excited about stocks. But, when pessimism becomes too extreme, it can sometimes be profitable to go against the tide.
However, not many stocks have been reaching new highs over the past 30 days. This makes a strong rally less likely. Relative to its previous 25 trading days, the S&P 500 is right in the middle of its overbought/oversold range.
Given the weight of the evidence, stocks appear to be in a “neutral” risk state at this time.
This is intended for informational purposes only and should not be used as the primary basis for an investment decision. Consult an advisor for your personal situation.
Indices mentioned are unmanaged, do not incur fees, and cannot be invested into directly.
Past performance does not guarantee future results.
